Admission
Approves an entry request only while the local capacity bound is maintained. Congestion adjusts the soft admission limit. No request may exceed the hard admission limit.
LIMA
Department of Electrical Engineering & Computer Sciences, DGIST
Daegu, Republic of Korea
warehouse-20-40-10-2-1 with 1,000 agents. Runtime: 4.04 seconds.
LIMA keeps dense warehouse fleets moving without turning every local conflict into a fleet-wide planning problem.
It works as a coordination layer on top of reference routes supplied by any route planner. Computation and communication remain local as the fleet grows. Each agent retains the order of its reference route. This includes pickup-before-delivery constraints and chained task waypoints. Under explicit operating conditions, every agent reaches its destination in finite time. LIMA targets structured warehouses with single-lane aisles. Open free-space regions are outside its scope.
A route planner decides where each agent should go. LIMA decides how agents sharing an intersection can safely follow their reference routes.
Each intersection agent observes only its local configuration and reacts to three events. Admission protects the space required for relocation. Marshalling resolves a conflict as a local stack rearrangement problem. Recirculation resolves a persistent stall across multiple intersections. Waiting and temporary movement segments are inserted into the executed path. The agent then returns to its reference route.
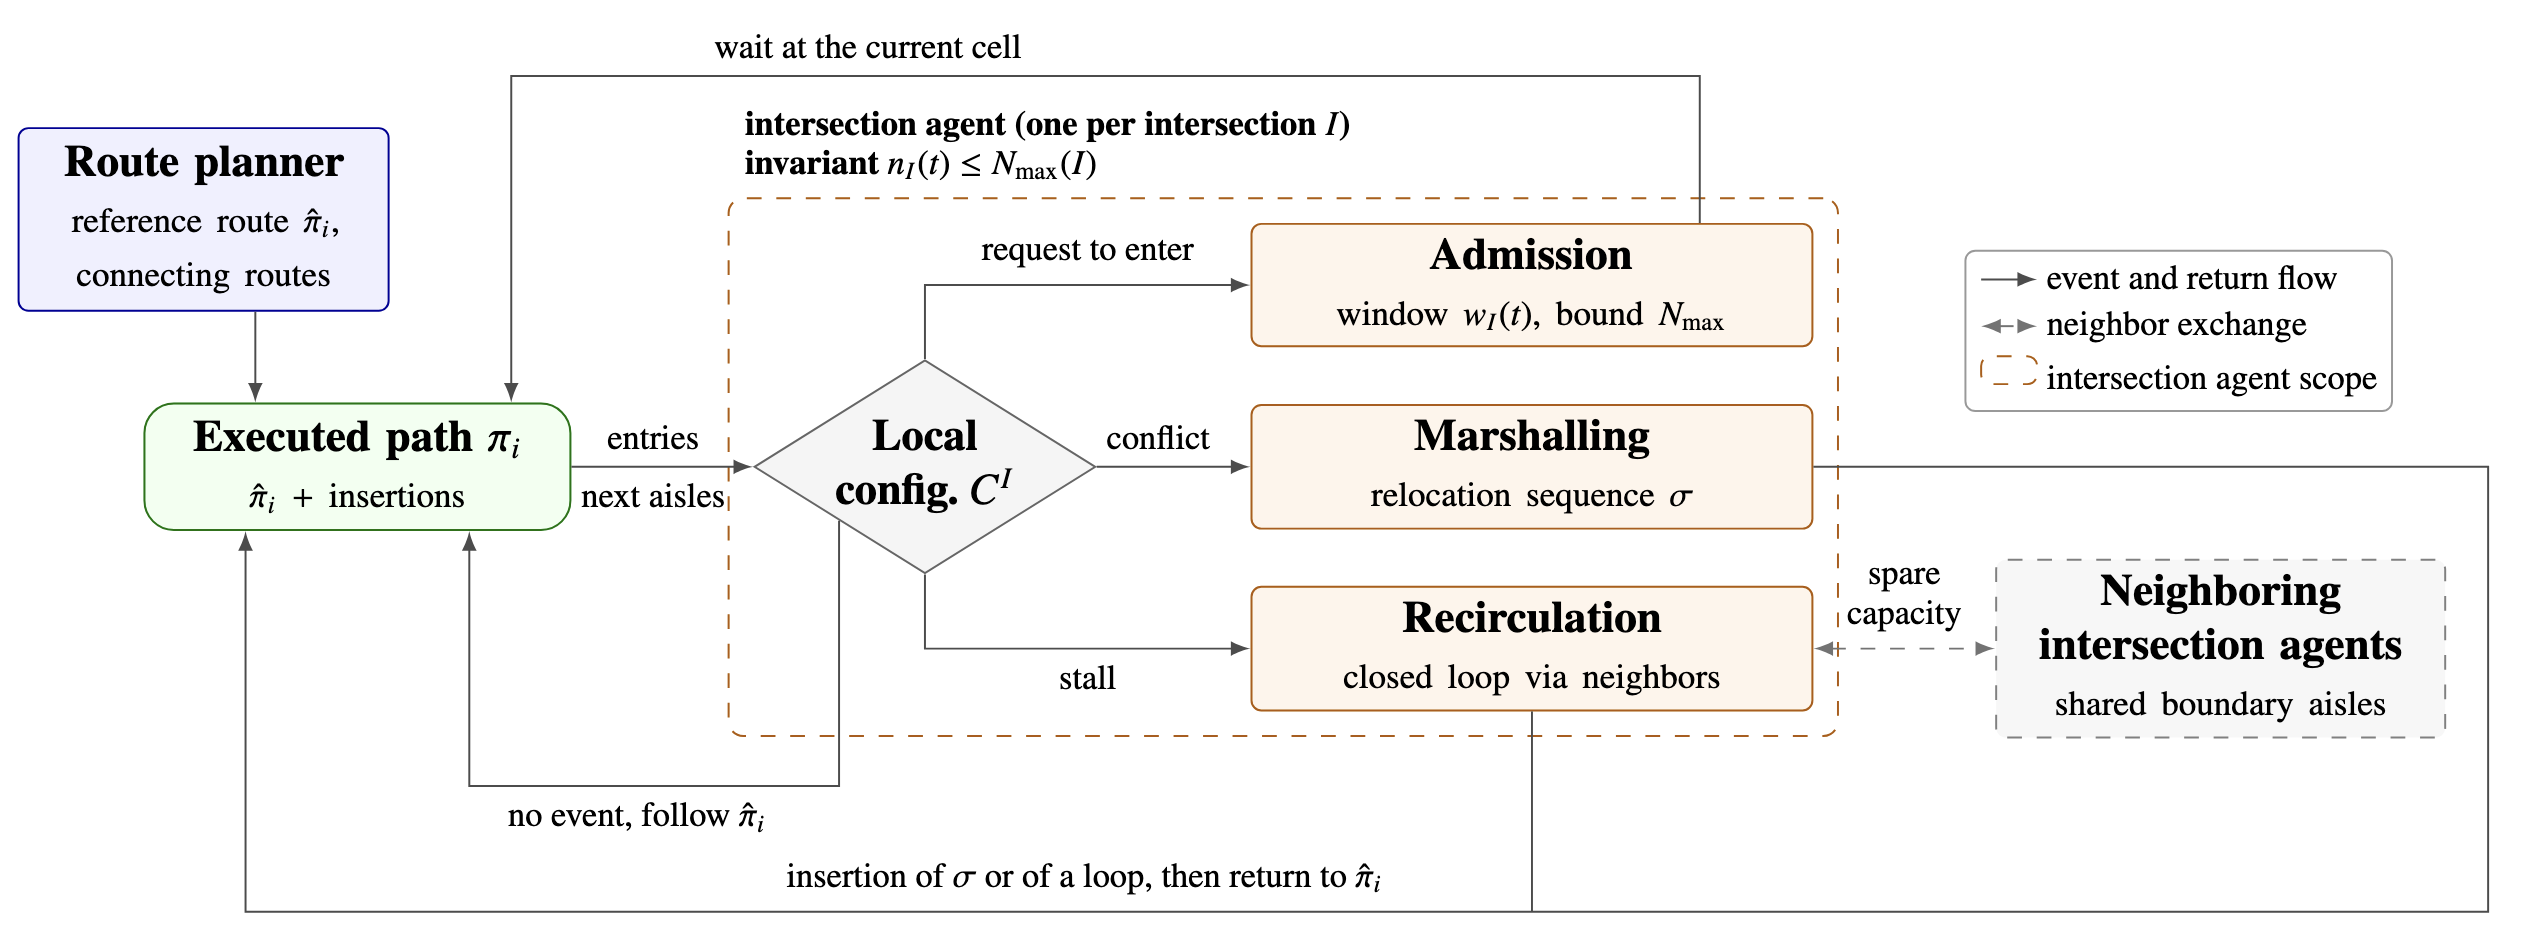
Approves an entry request only while the local capacity bound is maintained. Congestion adjusts the soft admission limit. No request may exceed the hard admission limit.
Treats the local configuration as a CPMP instance and computes a relocation sequence until every agent can reach its next aisle.
Temporarily moves one agent along a finite recirculation loop when a persistent stall spans multiple intersections.
The architecture preserves safety and the reference route while keeping each decision within one intersection and a bounded local neighborhood. Completion is guaranteed when finite reference routes exist, every intersection stays within its capacity bound, persistent stalls have a finite recirculation loop, and executable actions are not delayed forever.
LIMA is designed around the operational constraints that make dense warehouse MAPF difficult in practice.
Decision cost follows the number of agents in one intersection and its aisle geometry rather than the size of the map or the total fleet.
Every message stays within one intersection or crosses one edge of the intersection graph. LIMA does not aggregate global state or require continuous peer-to-peer exchange.
The route selected by the planner remains a subsequence of the executed path. Waypoint and task order are preserved even when traffic becomes congested.
A local capacity bound identifies where the completion guarantee applies. In the tested density ladder, incomplete LIMA runs occurred only in cells initialized above that bound.
The marshalling solver resolves a local conflict inside a single intersection without constructing a collision-free joint plan for the fleet.
The incident aisles are modeled as stacks. A relocation moves the agent nearest the intersection from one incident aisle to another. The resulting sequence is expanded into collision-free cell movements while preserving the order of every reference route.
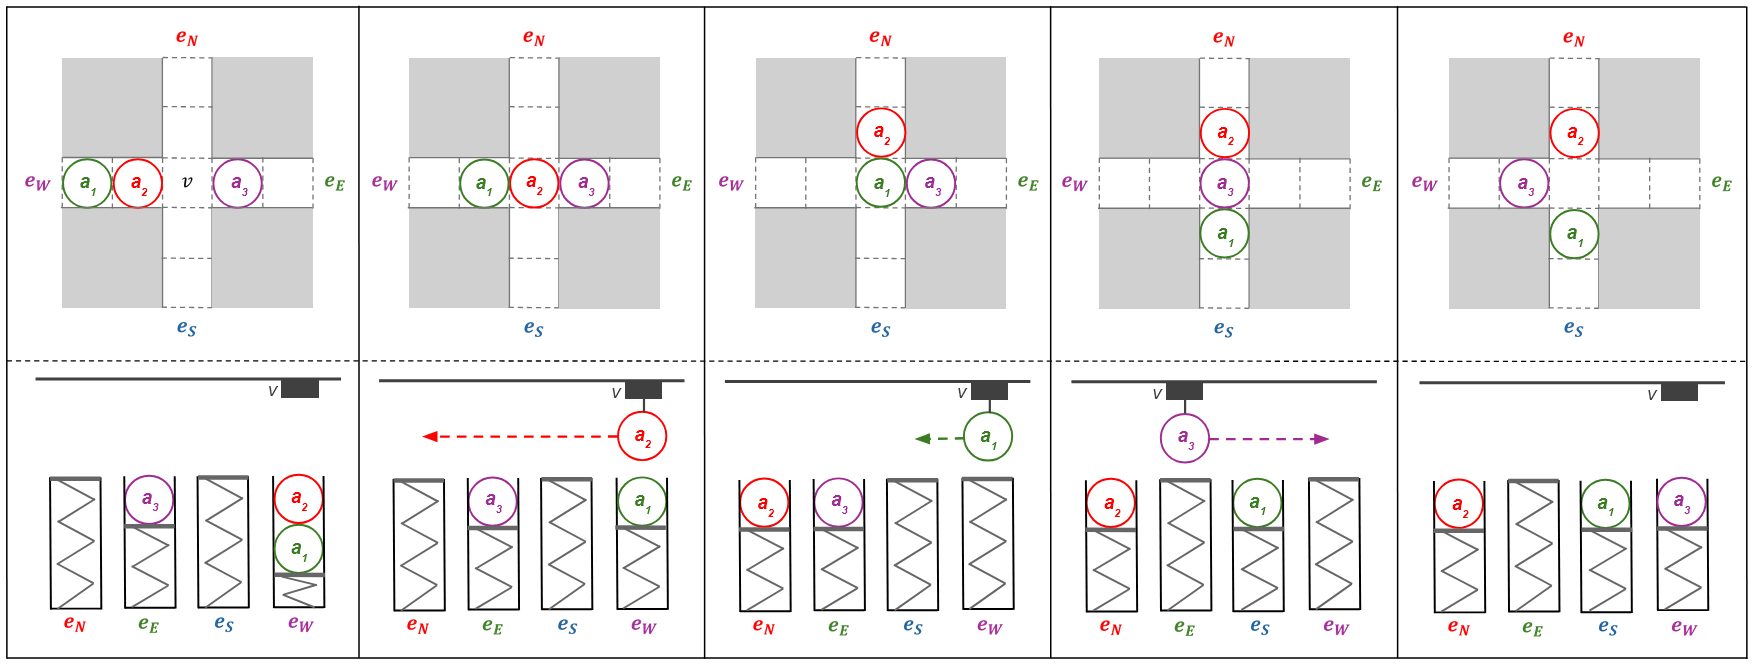
cross_1 · N=15 · completed in 37 steps.warehouse_1 · N=14 · completed in 48 steps.We evaluate LIMA in one-shot, movement-delay, and lifelong warehouse scenarios.
The experiments use Standard 1, Standard 2, and Square 1. The first two are benchmark warehouses with long shelves and narrow aisles. Square 1 uses square shelves and shorter path segments. Only the warehouse interiors are evaluated. Density is the fleet size divided by the number of traversable cells in that interior. All experiments use a C++ release build on Ubuntu 24.04. The test machine has an Intel i5-14400F and 32 GB RAM.

Agents start inside the warehouse and follow reference routes to boundary goals. An agent leaves the system after reaching its goal. LIMA uses SWR reference routes. CBS, LaCAM, and MAPF-LNS2 are centralized baselines. PIBT and PRIMAL 2 are decentralized online baselines. All methods use the same instances at densities from 1% to 70%. Each setting uses ten seeds and a 40,000-step limit. Centralized planners receive 600 seconds per planning call.
The one-shot task is repeated under movement delay. An approved move is replaced by a wait with probability 0, 0.05, 0.10, 0.15, or 0.20. All methods experience the same delays. PIBT chooses its next cell again at every step. LIMA recomputes the relocation sequence of the affected intersection after a delay. MAPF-LNS2 replans globally when execution departs from its plan. The methods are tested on three maps at 10%, 20%, and 30% density. Each setting uses three seeds and a 30,000-step limit.
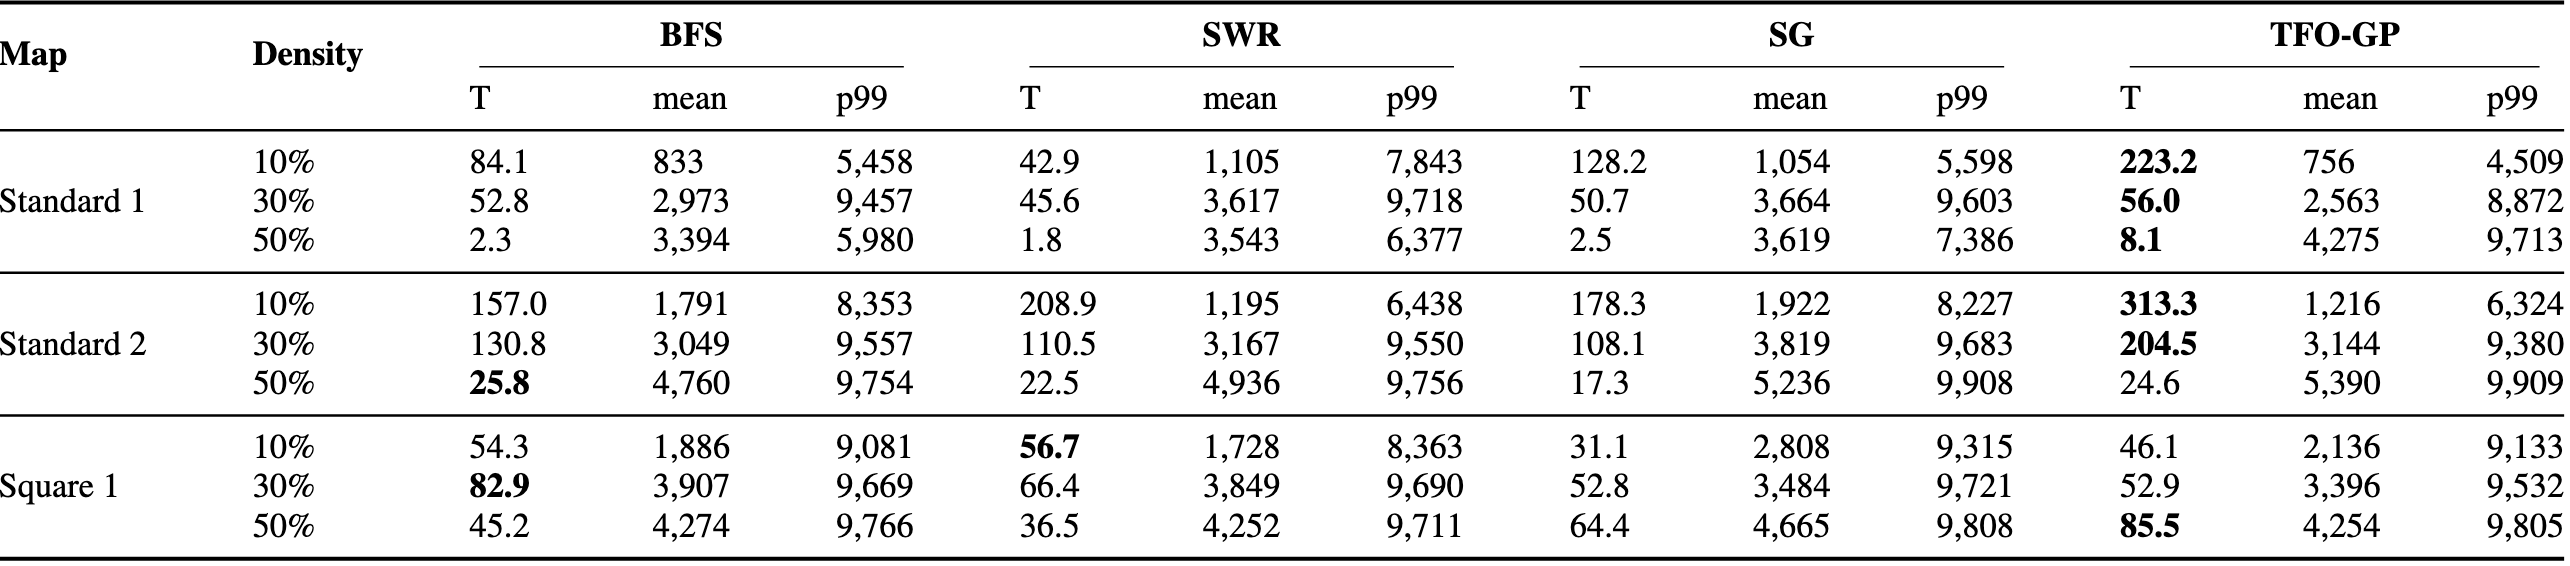
Agents remain in the warehouse and repeatedly receive pickup and delivery tasks. Every route planner receives the same task sequence. BFS returns shortest paths. SWR uses structured waypoints. SG assigns preferred directions to aisles. TFO-GP penalizes heavily used cells and edges. Each planner is combined with LIMA at 10%, 30%, and 50% density. Each setting uses five seeds and 10,000 steps. The first 1,000 steps are discarded as warm-up. The remaining 9,000 steps form the measurement window.
Every one-shot trial whose initial placement respected the capacity bound completed, up to 7,140 agents.
The marshalling solver's p95 solve latency was 84 ms across the full one-shot campaign.
Every tested inserted segment returned to the reference route without changing its goal.
Metrics. A run is successful when every agent reaches its boundary goal within 40,000 steps. Agent arrival ratio is the fraction of the fleet that reaches its goal across ten seeds. Completion step is the final arrival step averaged over successful runs. The local capacity bound reserves enough free aisle cells for relocation at one intersection. Map capacity is the largest fleet that can be placed while every intersection satisfies this bound. The Capacity column reports fleet size as a percentage of map capacity. A dash means that memory demand exceeded 32 GB.
Result. LIMA completed every one-shot trial at the tested densities within the capacity bound. The largest successful fleet had 7,140 agents. Incomplete runs appeared only above the bound.
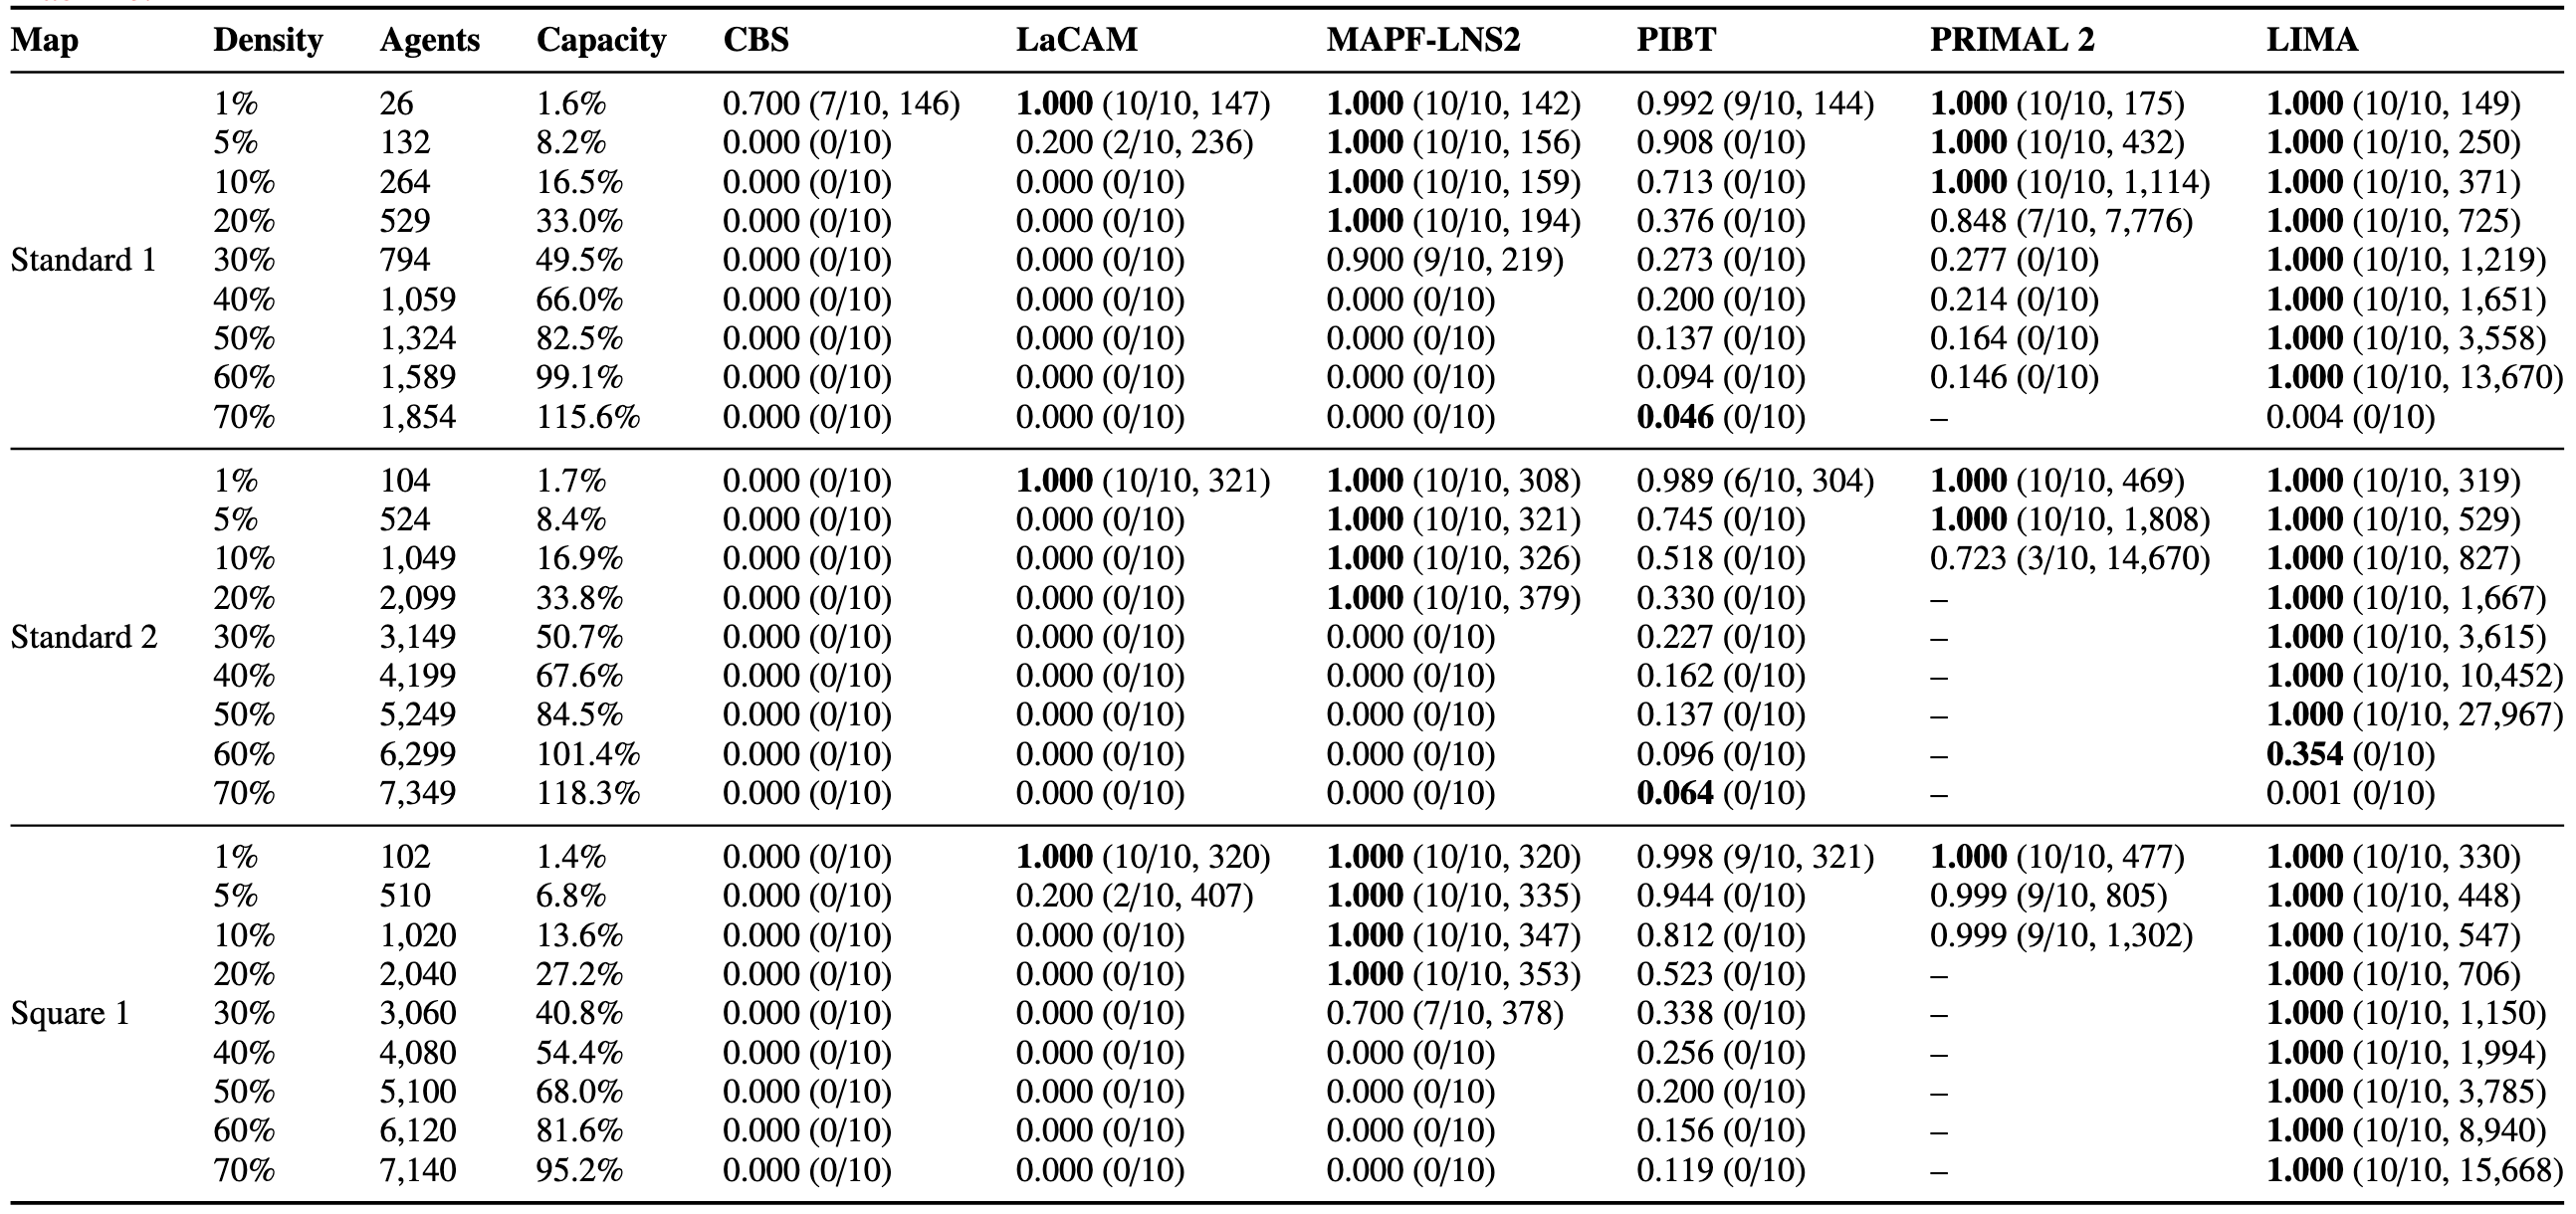
Centralized baselines stopped at lower densities. PIBT and PRIMAL 2 degraded as congestion increased.
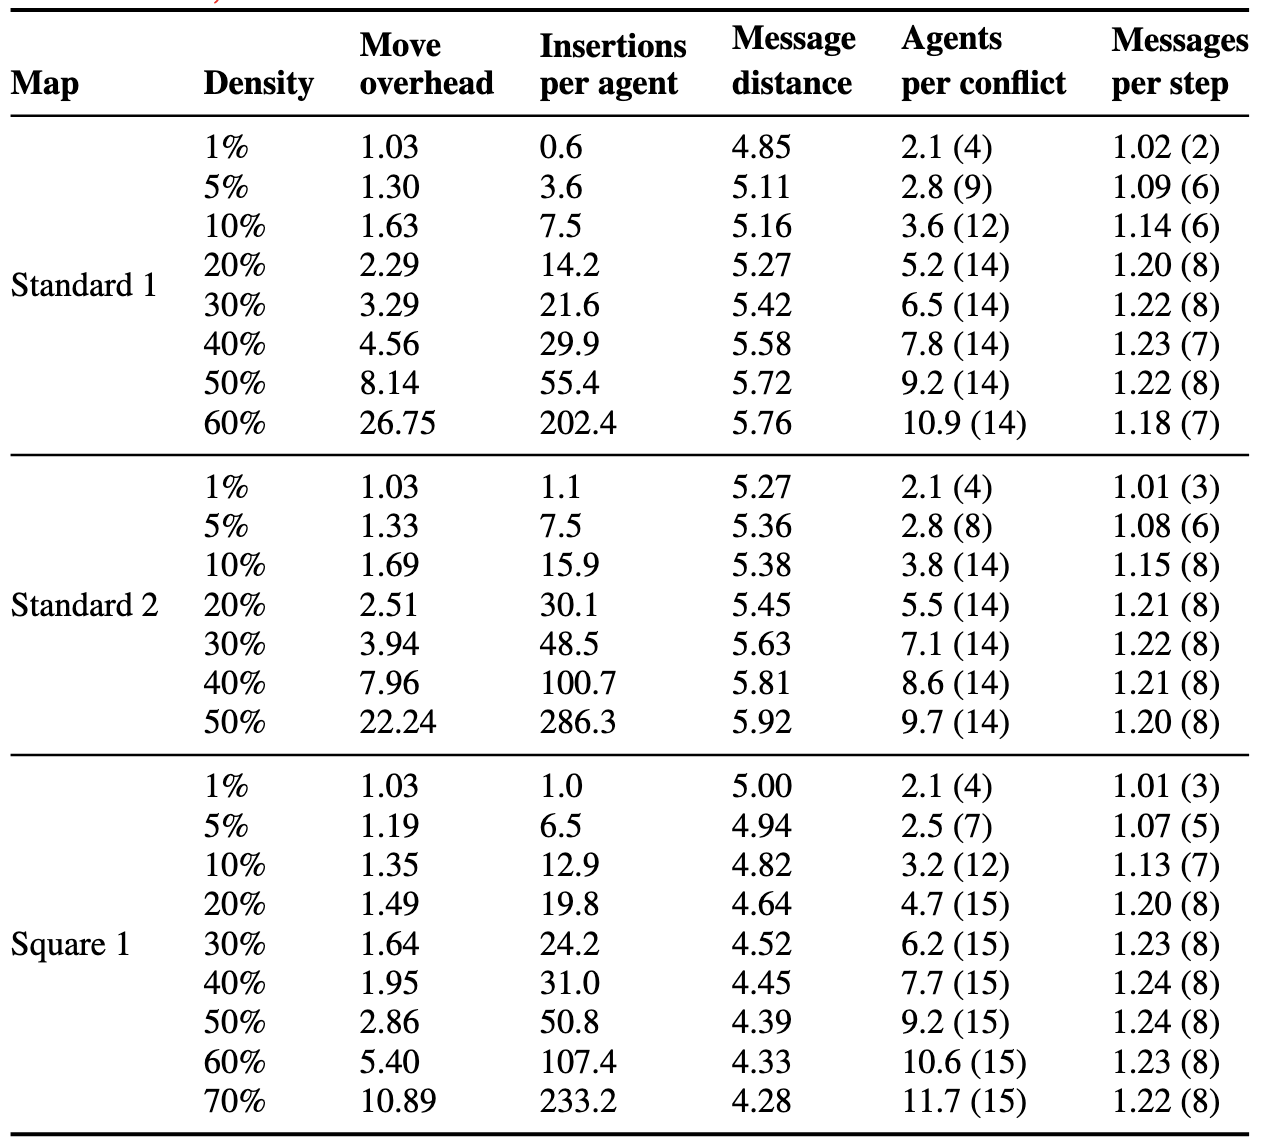
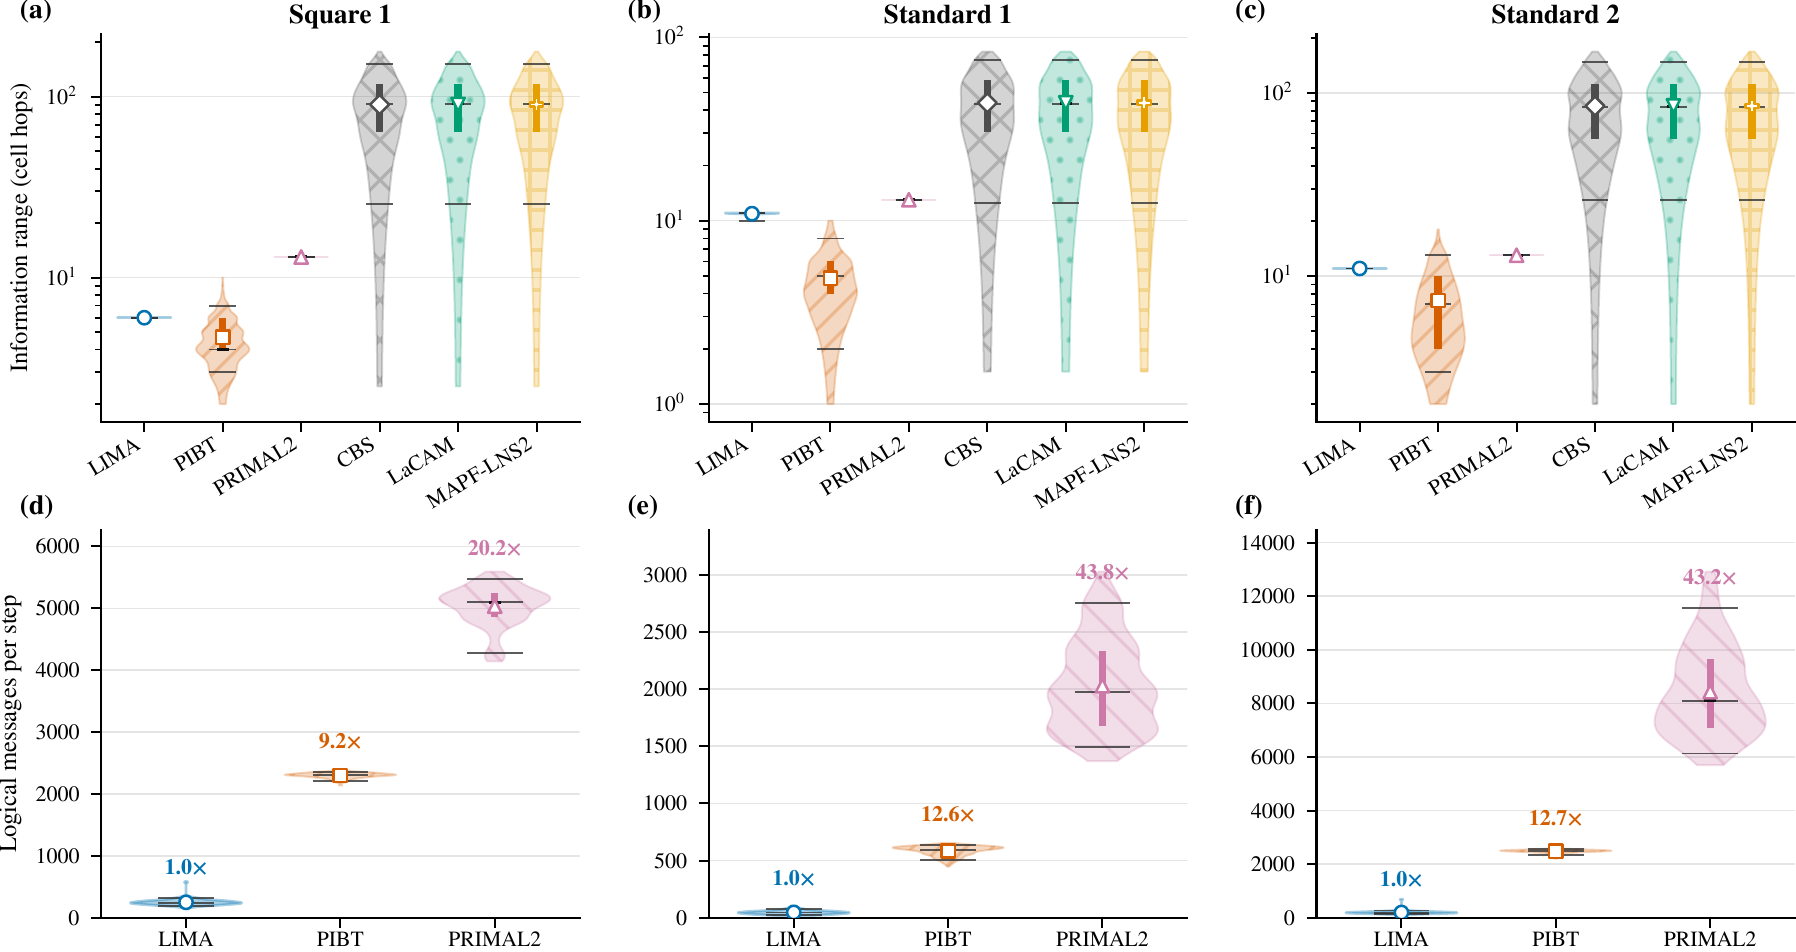
The same one-shot runs measure the cost of preserving reference routes and the communication handled by each intersection agent. The comparison figure uses 10% density on all three maps. It pools the five movement-delay probabilities over the first 100 steps.
Metrics. Route preservation is the fraction of agents whose inserted segments all rejoin the reference route without changing the goal. Move overhead is executed moves divided by reference-route moves. Insertions per agent is the average number of finite segments added by LIMA. Message distance is the number of cells traveled by a message. Agents per conflict counts agents in one local conflict. Messages per step counts inbound messages received by one intersection agent. Parentheses show maxima over ten seeds. Information range measures how far consumed information travels in cell hops. Logical messages count sender-to-receiver transmissions per step.
Result. Route preservation was 1.000 in every run within the capacity bound. Mean message distance remained 4.3–5.9 cells. Each intersection agent received 1.01–1.24 messages per step on average. At 10% density, LIMA used a range of 6–11 cells. It sent 9–13 times fewer messages than PIBT and 20–44 times fewer than PRIMAL 2.
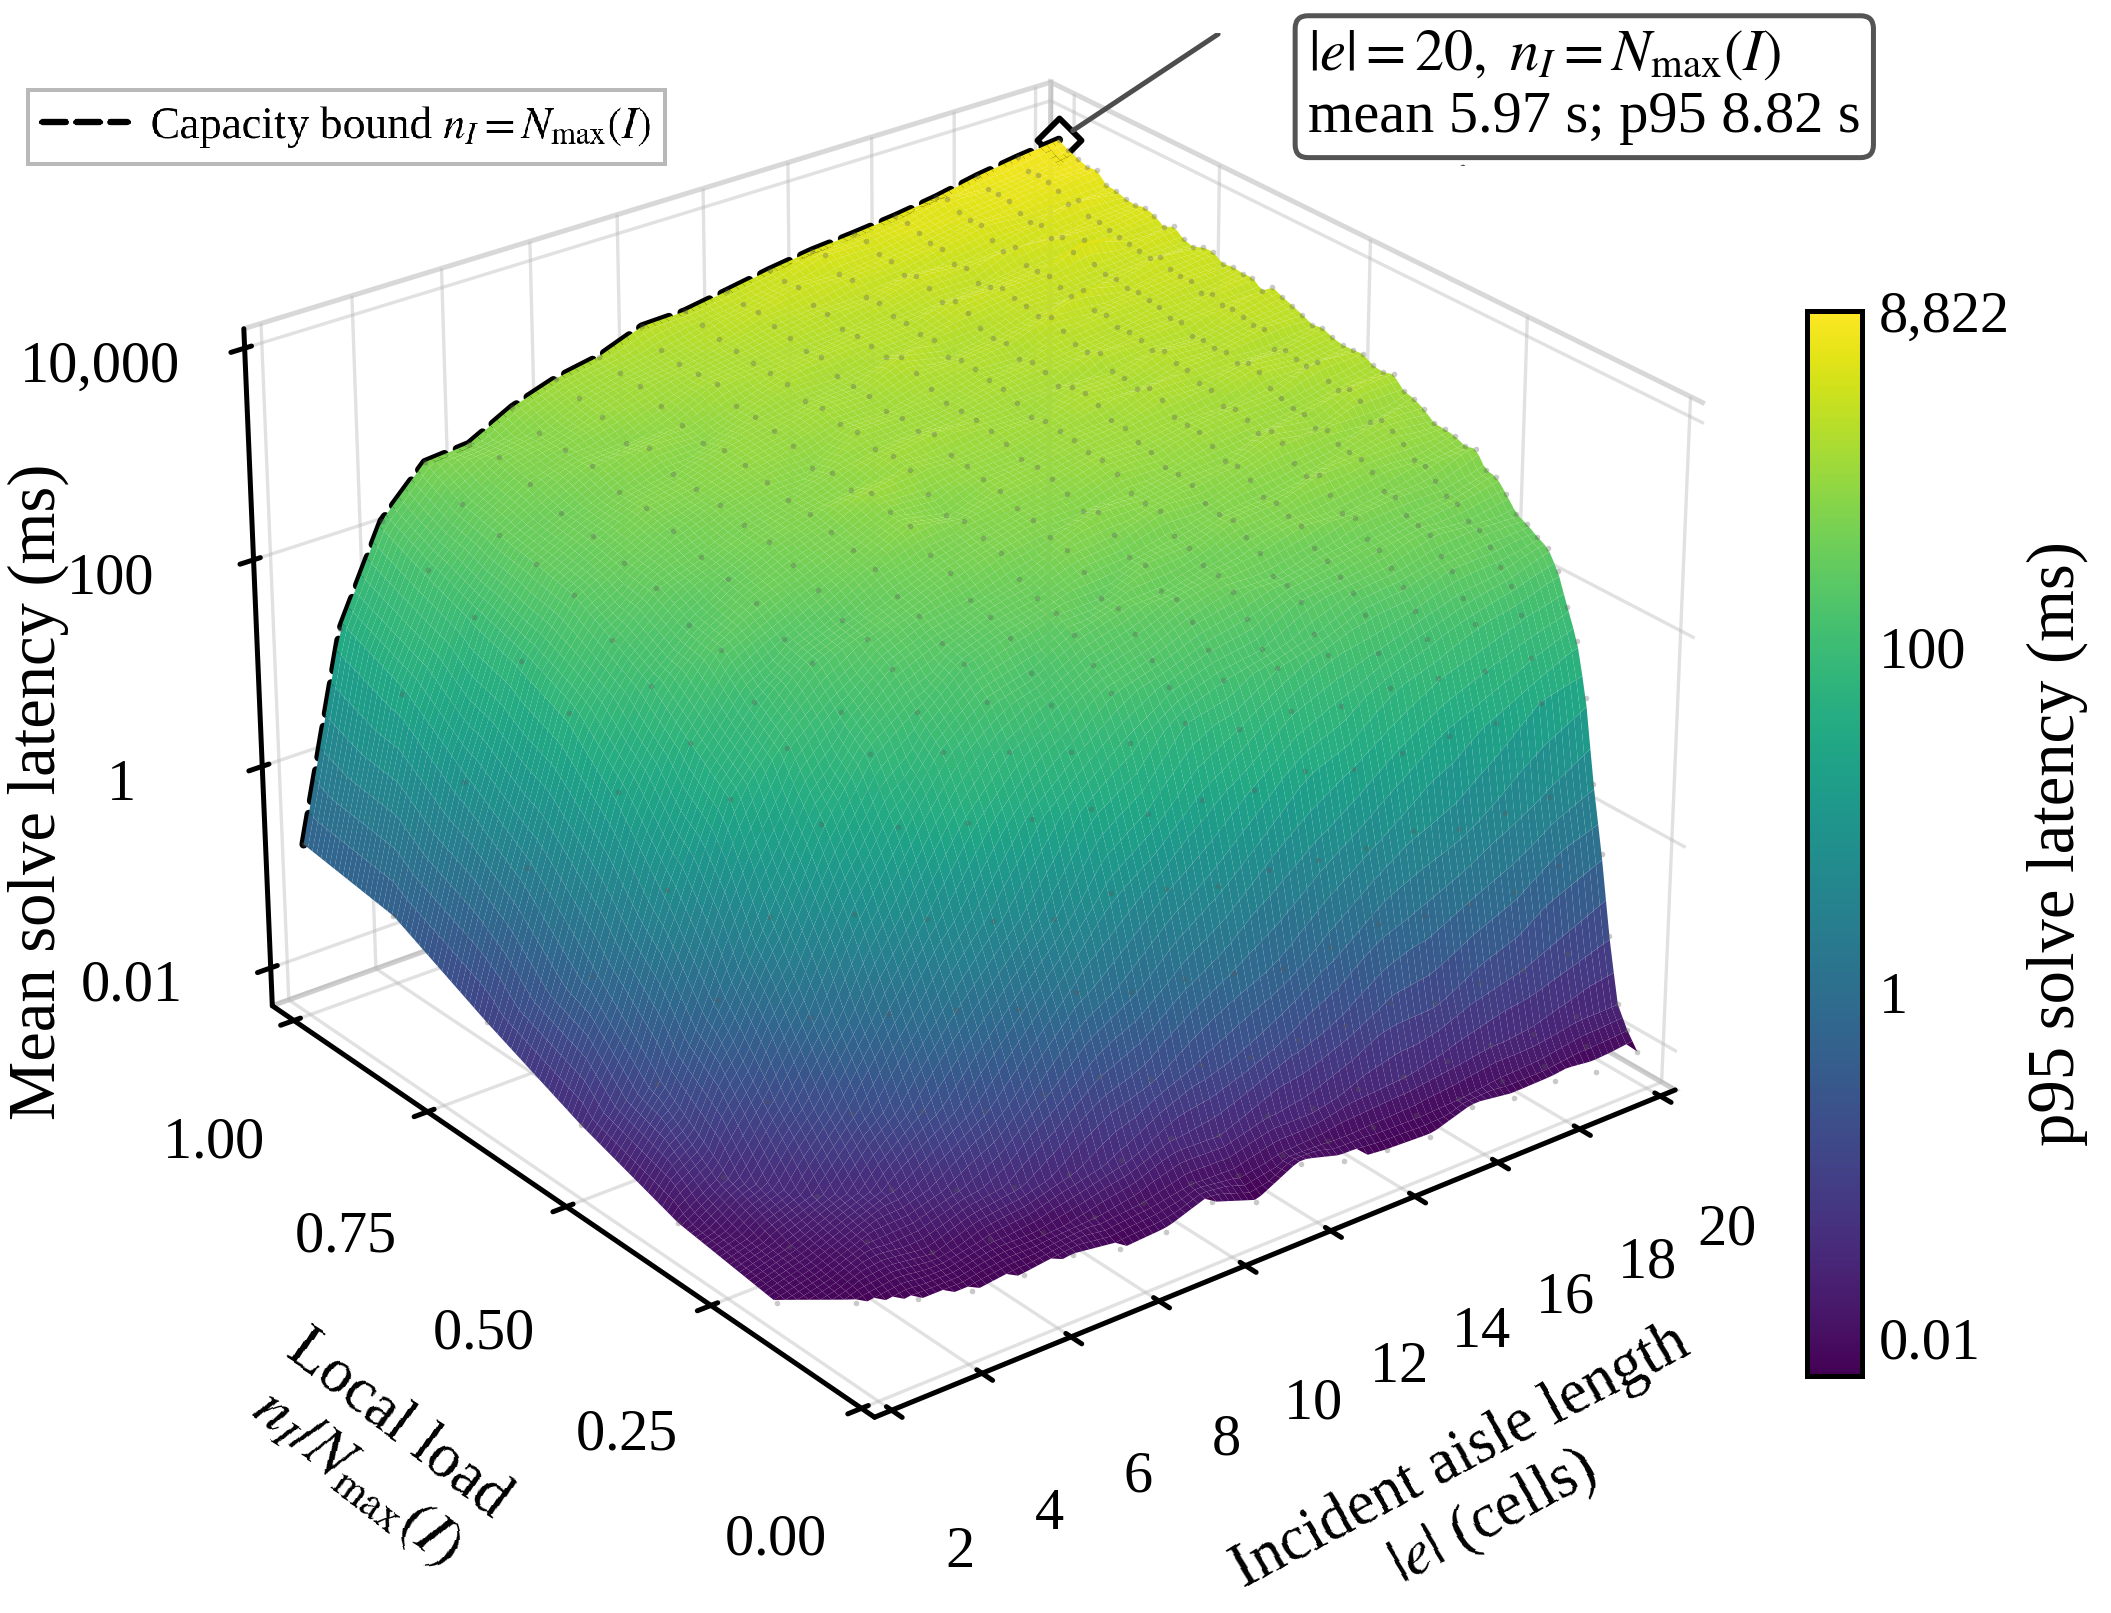
The one-shot campaign records one solver call for each local conflict. A separate surface experiment tests 100 random local instances at each combination of incident aisle length from 2 to 20 cells and local load up to the capacity bound. The surface measures beam search alone. The deployed solver uses IDA* as an exact fallback when beam search does not find a relocation sequence.
Metrics. Solve latency is the wall-clock time for one marshalling solver call. Mean is the average latency. The p95 value is the latency at or below which 95% of calls finish. In the surface plot, height shows mean latency and color shows p95 latency. The dashed line marks the capacity bound.
Result. The campaign recorded 5.76 million conflicts. Mean marshalling solve latency was 18 ms (p95: 84 ms). The exact fallback was never invoked.
Metrics. The delay probability p is the chance that an approved move becomes a wait. Each p contains 27 trials from three maps, three densities, and three seeds. Success is the number of trials in which every agent arrives within 30,000 steps. Arrival is the pooled agent arrival ratio. Step is the mean final arrival step of successful trials. Replans is the mean number of global replans per trial.
Result. LIMA completed all 135 trials across the five movement-delay settings.
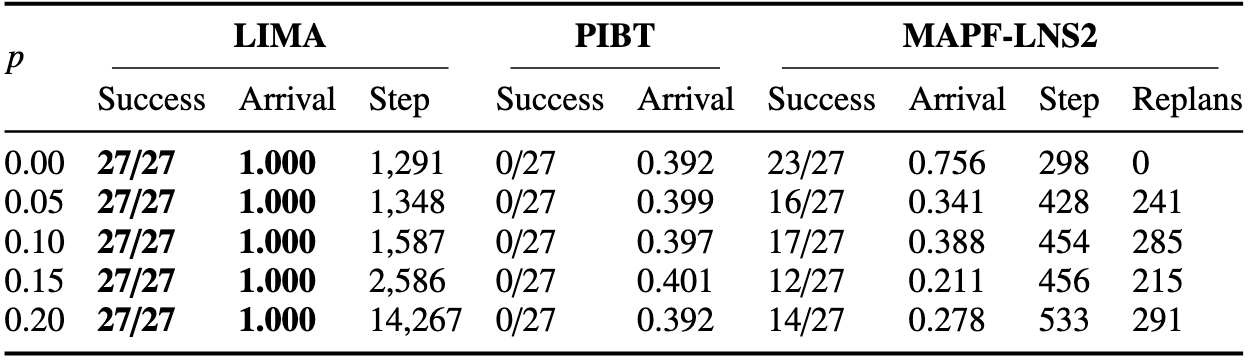
LIMA recomputes only the relocation sequence of the affected intersection. The slowest LIMA trial took 7 minutes. The slowest successful MAPF-LNS2 trial took 4.5 hours.
Metrics. Throughput T is the number of completed deliveries per 1,000 steps of the measurement window. Service time is the number of steps from task assignment to delivery. Mean reports the average service time. The p99 value is the service time at or below which 99% of completed tasks finish. Tasks still open at the end of the experiment are excluded from service-time statistics.
Result. All four route planners maintained positive throughput. TFO-GP led six of nine settings.
Citation information will be added after the paper is published.