Architecture, features, and the research behind it.
Switch between tabs for the layered architecture, the feature surface, live demos, and the paper.
Every other ROS 2 observability tool attaches somewhere inside the application stack: rclcpp, rcl, rmw, or the middleware itself. ros2probe is the only layer that sits below the middleware, in the kernel network path.
Attach inside the stack
ros2_tracing adds tracepoints in rclcpp / rcl. CARET wraps rmw with LD_PRELOAD. rosbag2, ros2 topic echo, recorder tooling, and transport stats tools all create endpoints in the middleware itself. Each becomes part of the stack being observed.
Tap from below the middleware
A kernel-space eBPF socket filter sees wire frames as they leave or enter the NIC. Userspace reassembles, decodes, and reconstructs the graph. The middleware never sees ros2probe.
ros2probe pipeline
Memory-mapped TPACKET_V3 ring, per-interface workers
Kernel timestamps arrive with each frame. Loopback is included by default so intra-host traffic is captured too.
DDS / Zenoh parser, fragment reassembly
Protocol decoding is shared at the same layer, with explicit wire-format parsers for DDS/RTPS and Zenoh rather than middleware symbol hooks.
Participants, endpoints, nodes, topics
For DDS, discovery packets (ros_discovery_info) bind endpoint GUIDs to ROS node namespaces. For Zenoh, equivalent discovery/control metadata is used to map peers, endpoints, and topics. TTL sweep keeps state fresh when nodes disappear.
CLI · GUI · MCAP recorder
A single Unix socket command bus multiplexes all consumers. Sessions open and close, the kernel filter follows automatically.
Zero ROS subscriptions
ros2probe never joins the middleware graph. Your ros2 topic list stays clean.
Full graph reconstruction
Participants, endpoints, node names, and pub/sub relationships are derived from wire-level discovery metadata and protocol-native control packets for each supported middleware.
SHM topic visibility
SHM-only topics are made observable on demand through a mount-namespace-isolated DDS helper or a non-SHM Zenoh subscriber.
Live topic metrics
Publish rate (hz), bandwidth (bw), end-to-end delay, and decoded echo, all with sliding-window statistics.
MCAP recording
Bag files with optional zstd / lz4 compression, pause / resume, and per-topic selection.
CLI + GUI
Same data, two interfaces. rp for shells and scripts, rp gui for visual exploration.
Topic classification
tf, parameter_events, rosout, debug, and SHM-only topics are automatically classified and separated in every UI.
Data-centric discovery sync
Each discovery event immediately updates the kernel whitelist. Protocol ordering ensures discovery state is registered before related payloads are processed, with no time-based window needed.
Protocol-level decoding
Wire-level parsers for DDS/RTPS and Zenoh avoid vendor-specific symbol hooks and BTF/CO-RE coupling.
1. Start the runtime
# auto-escalates to root if needed (CAP_NET_ADMIN + CAP_NET_RAW)
rp run
Zenoh transport port 7447 is monitored for both TCP and UDP by default. Supplying the option replaces that default; list every port that should be monitored when a deployment uses custom or multiple ports.
# monitor Zenoh traffic on both ports
rp run --zenoh-transport-port 7447 7448
Run rp run first, then launch your ROS 2 nodes. The runtime needs to be observing before the participants announce themselves so it can capture discovery traffic. If you start rp run after nodes are already up, run rp discover to trigger a one-shot discovery sync for the existing graph. For a Zenoh-only refresh, rp discover --zenoh queries a locally reachable TCP or UDP endpoint on the transport ports configured when the runtime started.
Only unencrypted Zenoh TCP and UDP transports can be passively decoded. Encrypted transports such as TLS and QUIC are not supported.
2. Observe topics without touching the graph
rp topic list
rp topic info /chatter
rp topic hz    /chatter
rp topic bw    /scan
rp topic delay /imu
rp topic echo  /chatter --field data
3. Record a bag without joining the middleware graph
rp bag record /chatter /scan -o session.mcap --compression-format zstd
4. Open the desktop UI
rp gui
Same data, two interfaces
Scripts talk to rp over a Unix socket. Humans get a GUI with a dashboard, a topic monitor, and a bag recorder.
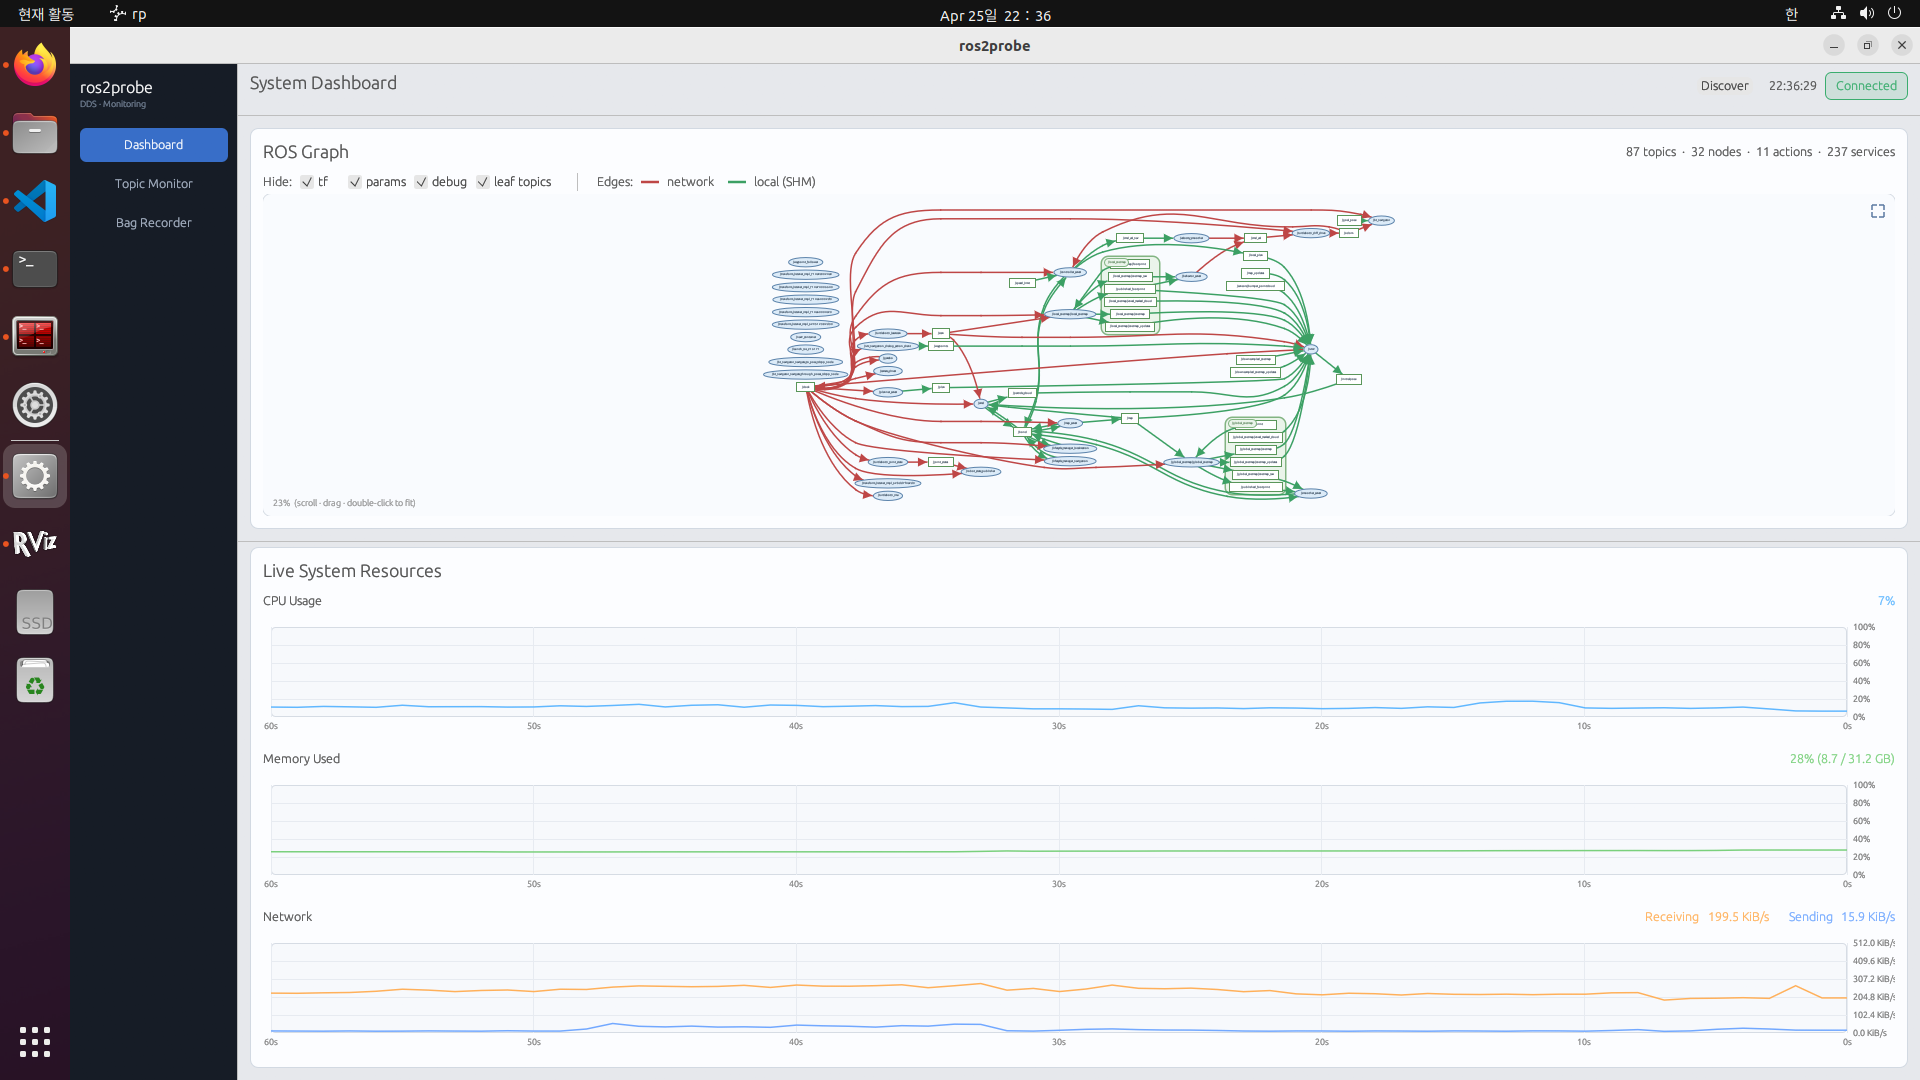
rp gui → Dashboard
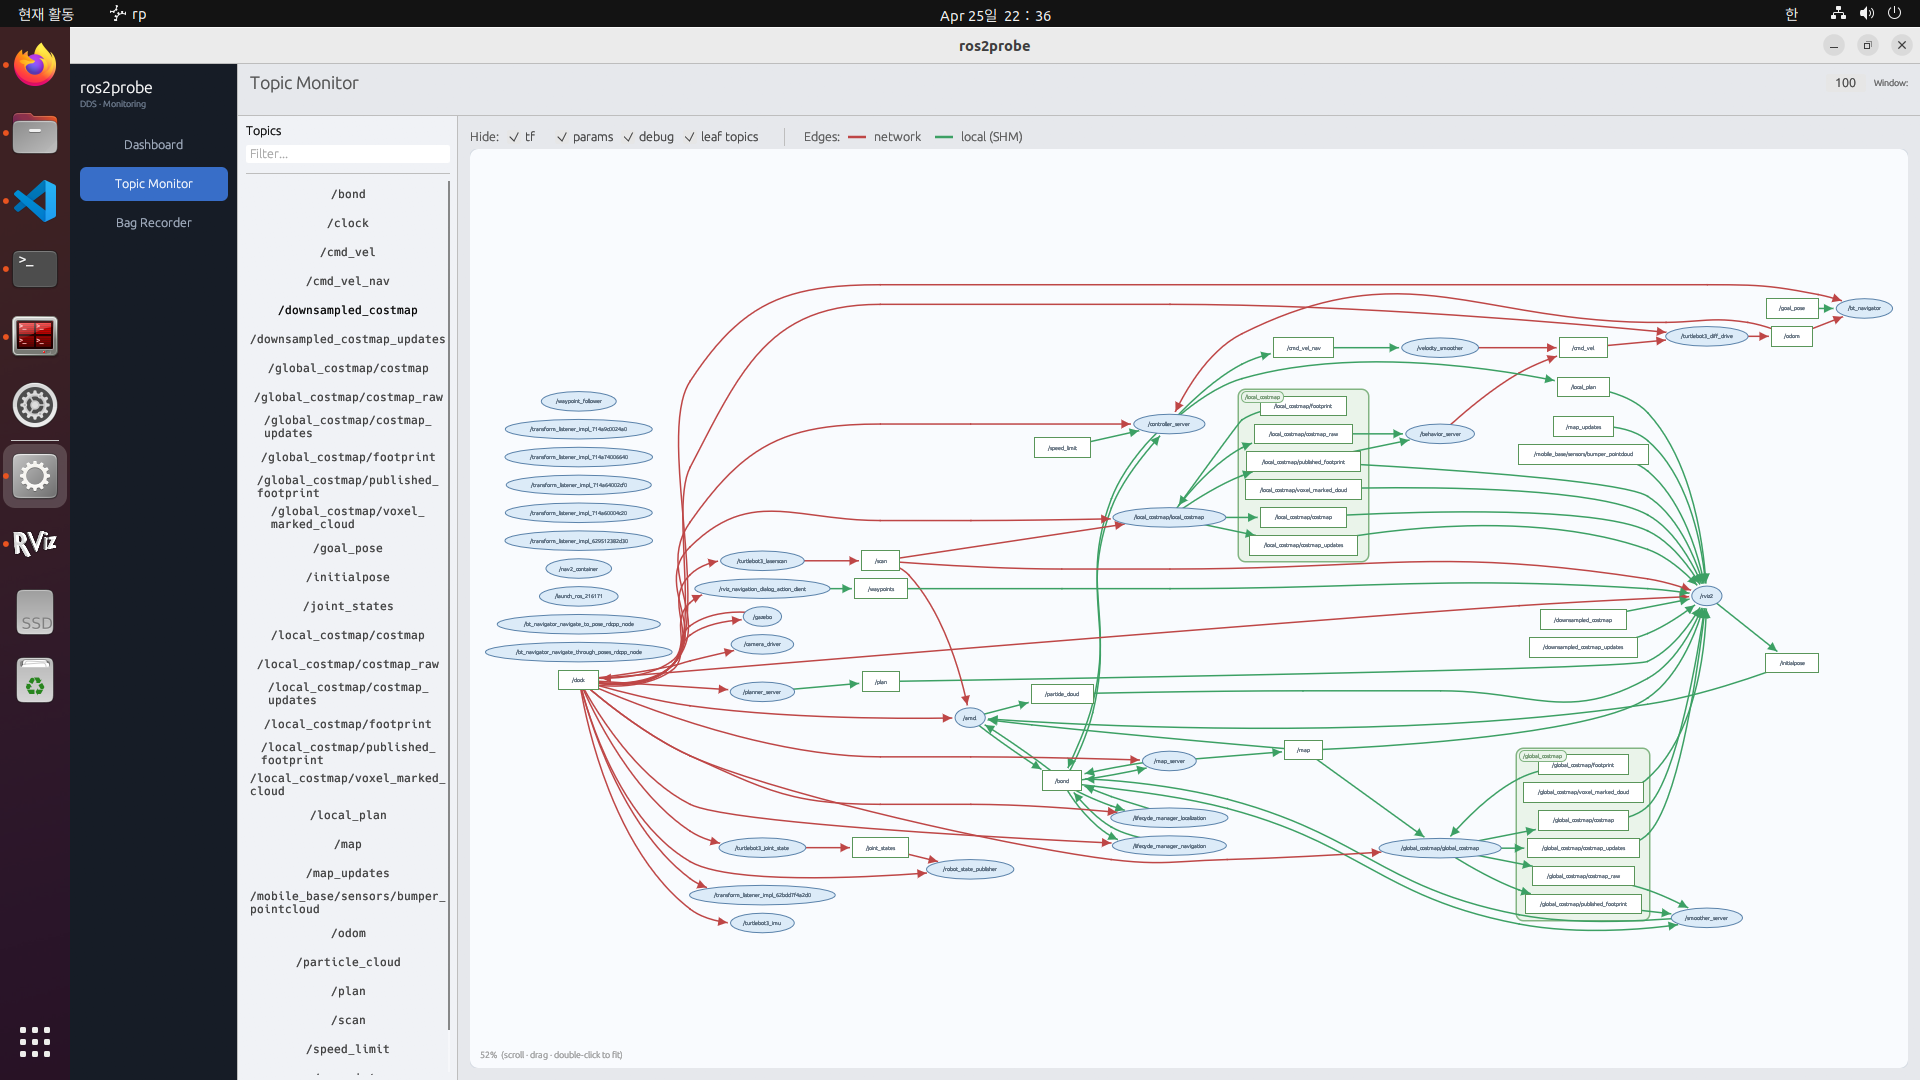
rp gui → Topic Monitor 1
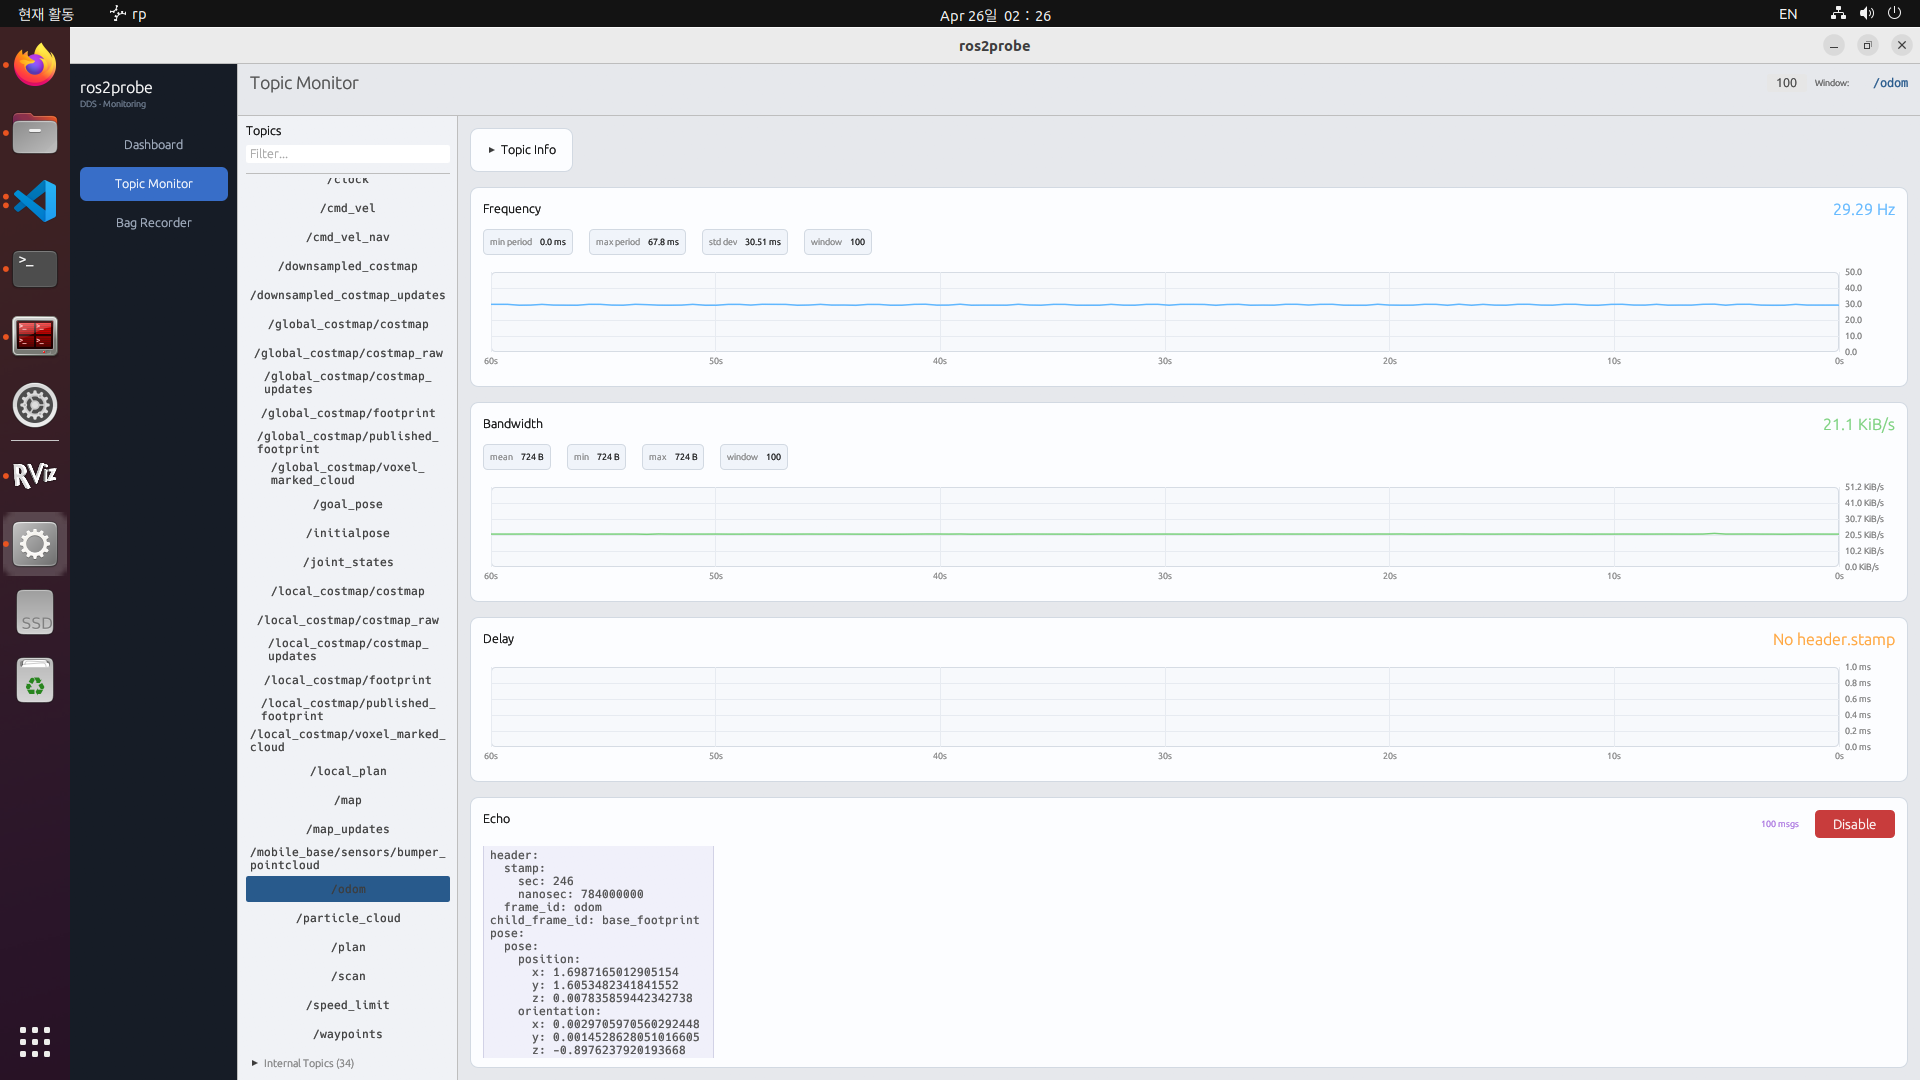
rp gui → Topic Monitor 2
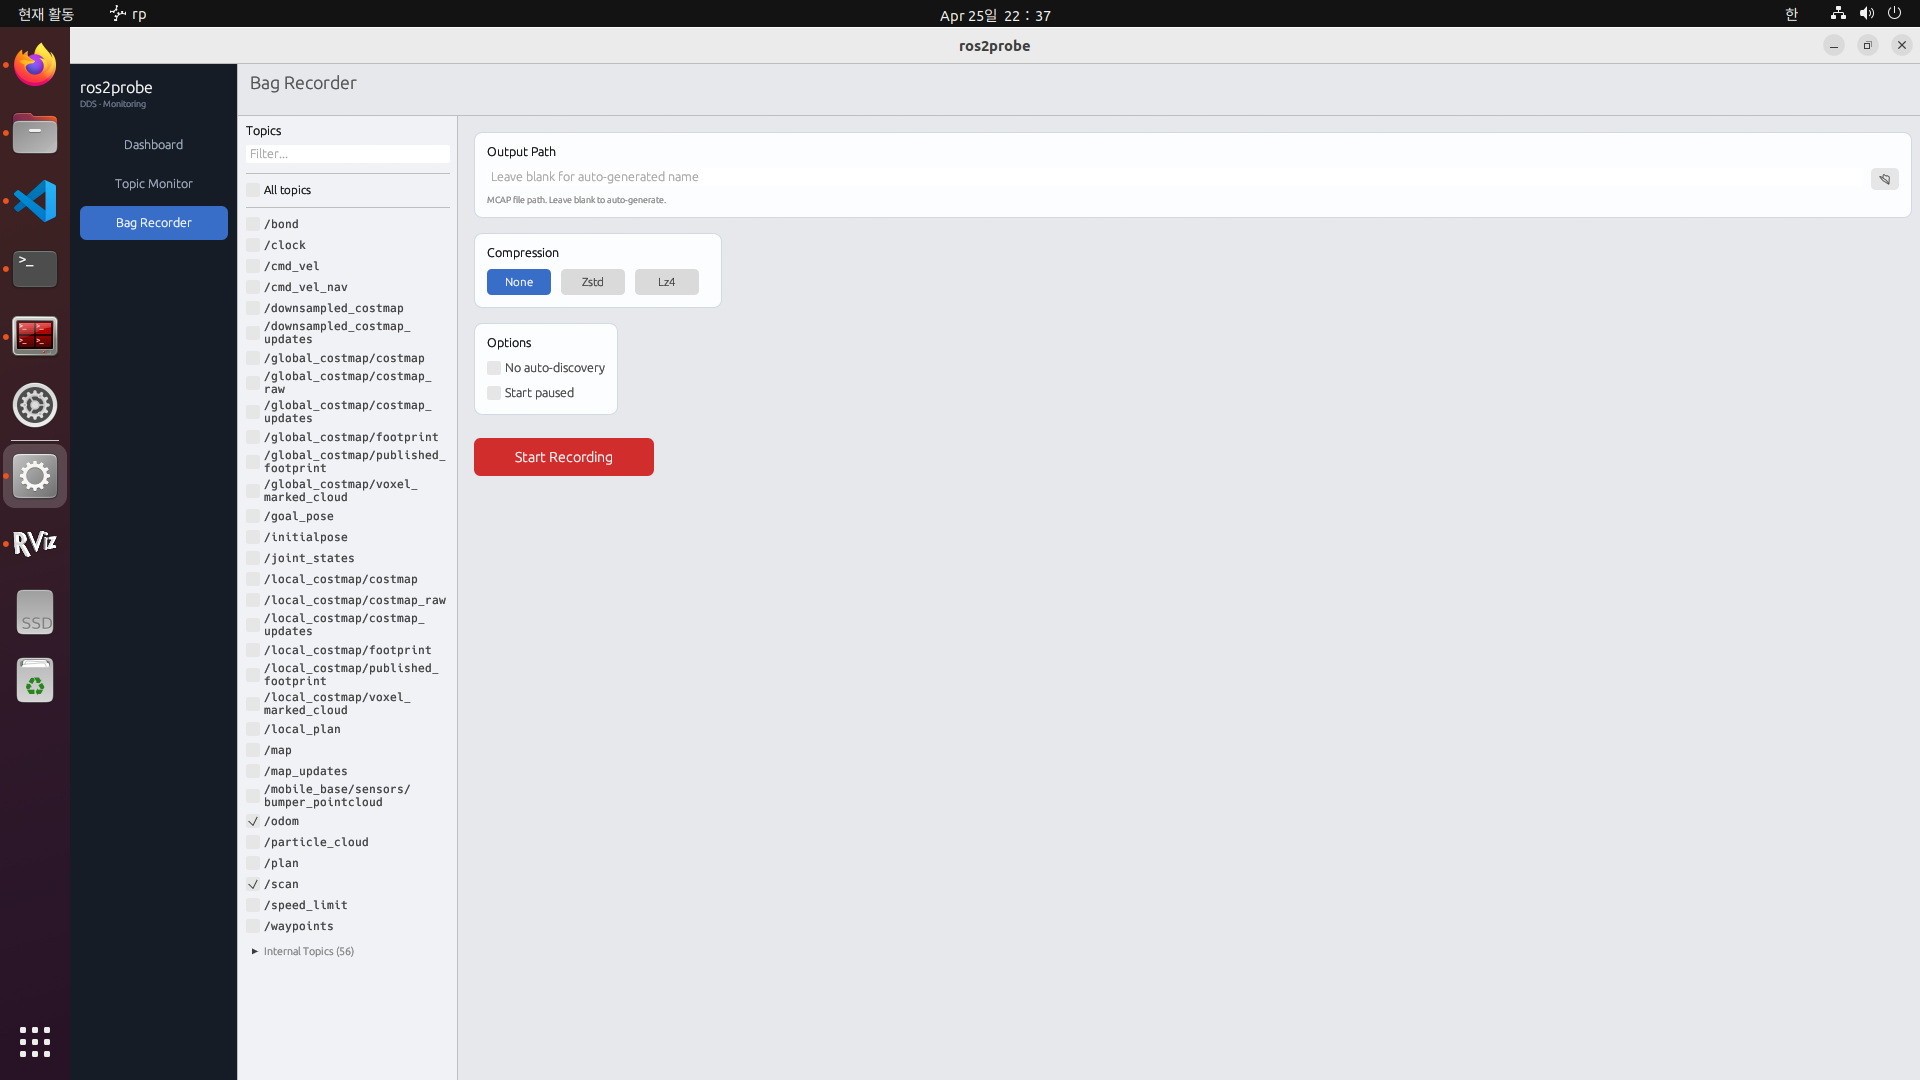
rp gui → Bag Recorder 1
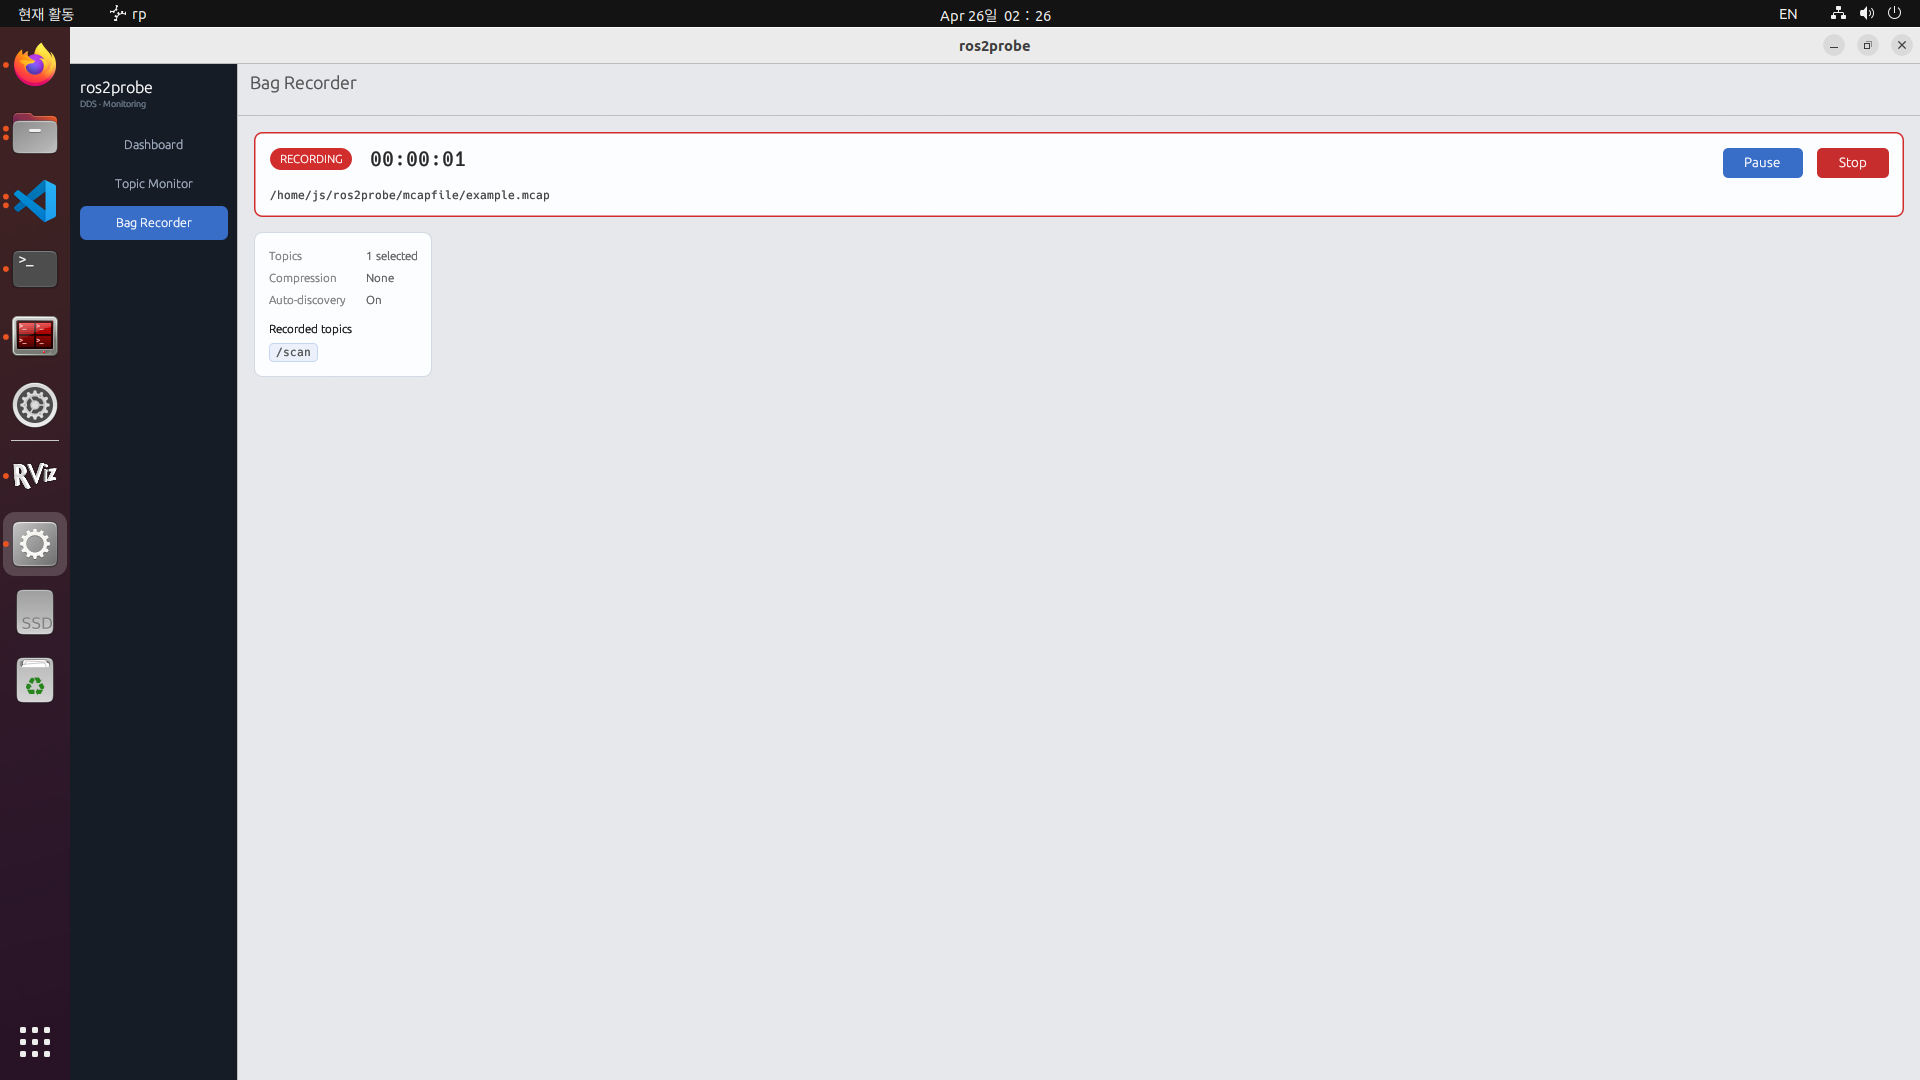
rp gui → Bag Recorder 2
Not all of these tools are built for the same thing. ros2_tracing and CARET are performance-analysis tools for callback chains and executors. rosbag2 and recorder tooling are loggers. ros2 daemon is a CLI cache. Wireshark is a general-purpose packet tool, passive but ROS 2-unaware, so it cannot reconstruct the topic graph and its cost grows with total traffic, not with what you observe. ros2probe aims at live middleware-level observation. The table below makes this explicit in the first row.
| ros2 daemon | ros2 topic | rosbag2 | ros2_tracing | CARET | Wireshark | ros2probe | |
|---|---|---|---|---|---|---|---|
| Purpose | CLI graph cache | Live topic CLI | Message logging | Callback / executor tracing | E2E callback-chain latency | Packet-level protocol inspection | Live middleware-level observation |
| Graph observation | △ | ✗ | ✗ | ✗ | △ | ✗ | ● |
| Message recording | ✗ | ✗ | ● | ✗ | ✗ | △ | ● |
| Callback / executor trace | ✗ | ✗ | ✗ | ● | ● | ✗ | ✗ |
| Non-intrusive | ✗ | ✗ | ✗ | △ | △ | ● | ● |
| Process restart not required | ● | ● | ● | ● | ✗ | ● | ● |
| Middleware-neutral | ✗ | ✗ | △ | △ | ✗ | ● | ● |
| Steady-state overhead | high | none (off) | none (off) | low | high | scales w/ traffic | minimal |
| Observer Effect on graph | yes | yes | yes | limited | limited | none | none |
● full support · △ partial / conditional · ✗ not supported
ros2_tracing and CARET solve a different problem (internal performance analysis) and are complementary to ros2probe, not competitors.
Abstract
Robot Operating System 2 (ROS 2), the de facto standard middleware framework for robots, runs each robot as a graph of nodes communicating over the Data Distribution Service (DDS), a publish/subscribe substrate. Observing this inter-node communication in real time is essential to robot development, yet observing it has a price. A tool can receive data only by joining the DDS domain as a subscriber that discovery has matched to the publisher, so the act of observing folds the tool into the system it measures and perturbs it.
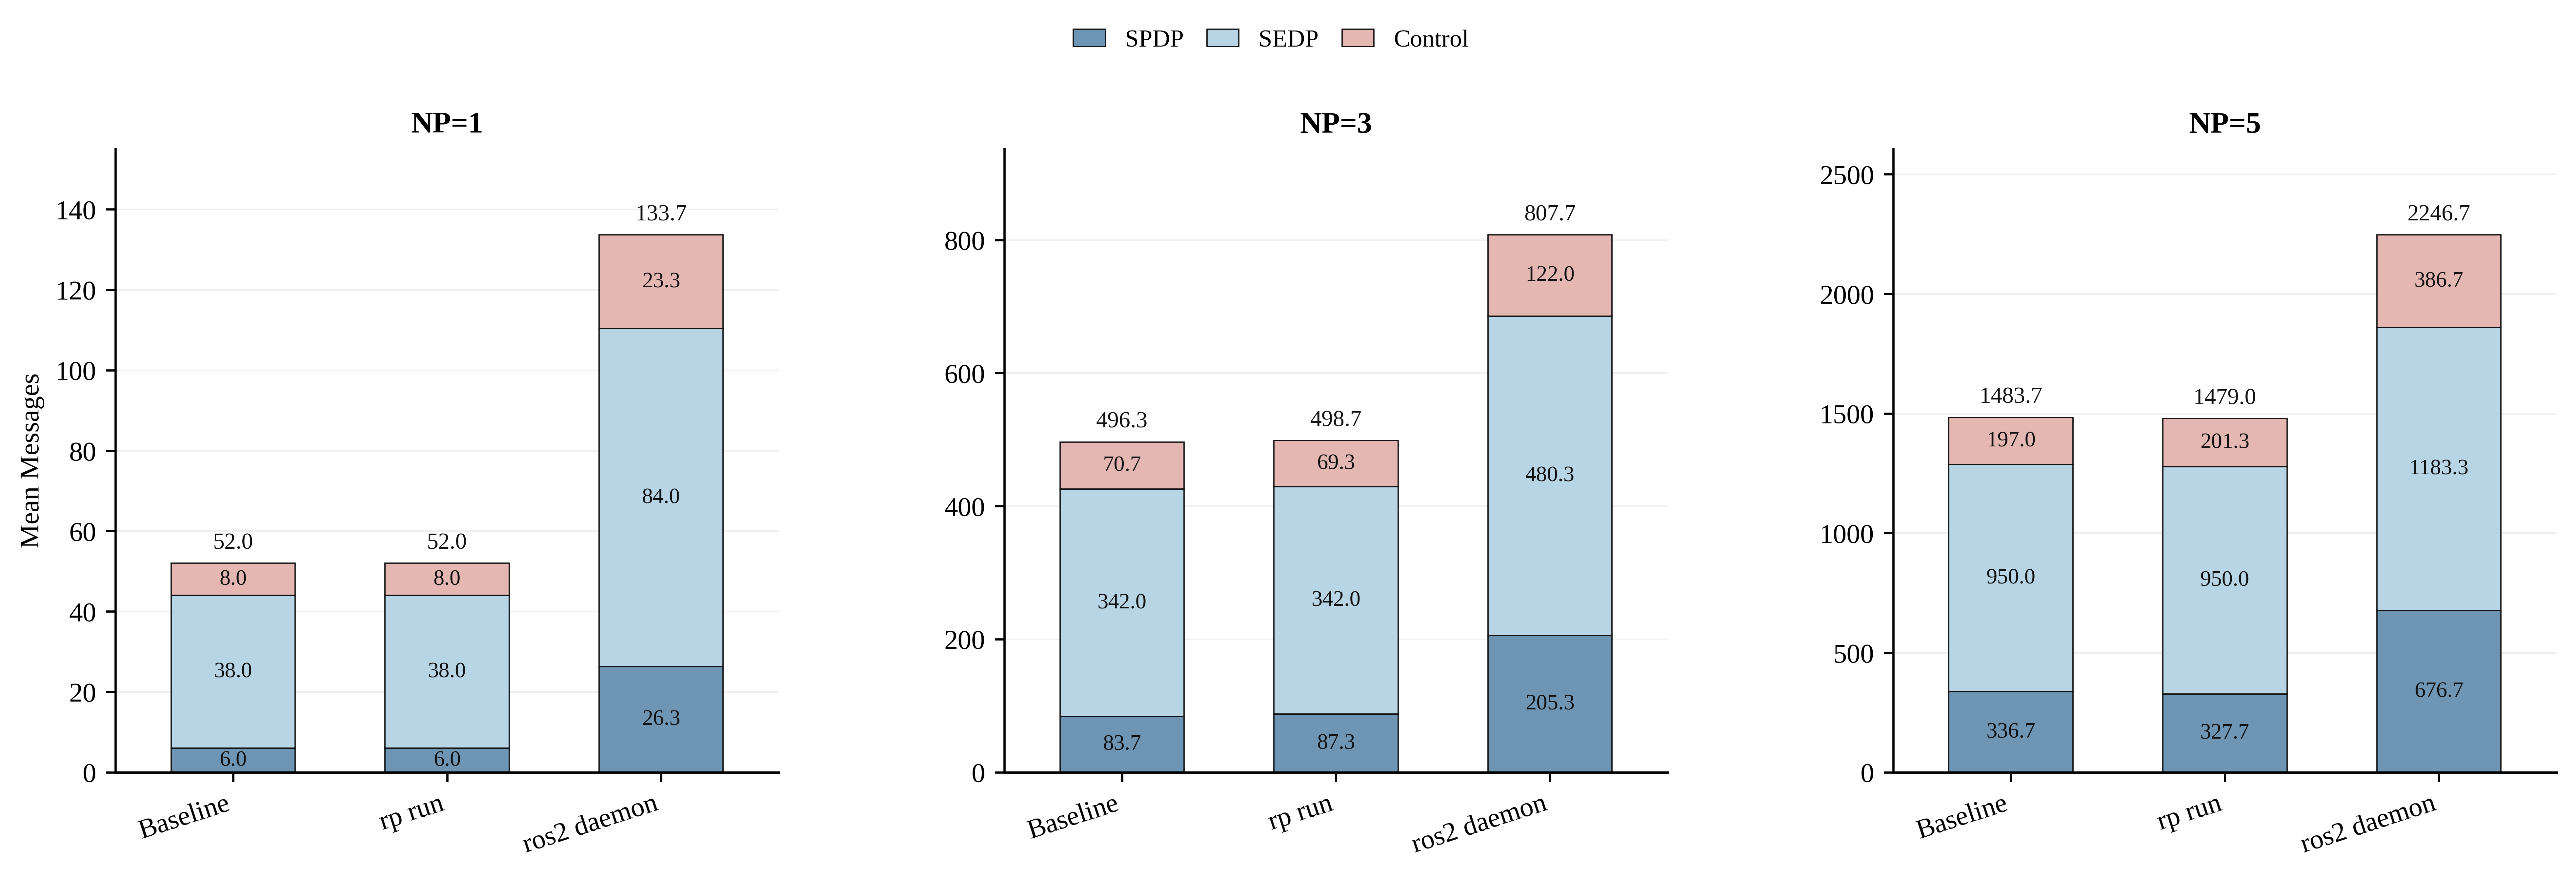
We define this protocol-inherent perturbation as the observer's probe effect. It inflates the discovery plane, adds deserialization cost on the observer, makes the loss it reports diverge from what the subscriber actually received, and near saturation displaces the subscriber's own messages. The only existing escape, capturing all wire traffic passively, discards the ROS 2 message semantics and scales with total traffic, not with what is observed.
We present ros2probe, a non-intrusive observation framework that removes the probe effect. It reconstructs the full ROS 2 communication state from the domain's discovery packets at no bandwidth cost, then drives an in-kernel filter restricted to the topics the user asks for, lifting only those packets at minimal cost and observing the messages the real subscriber receives. Its interfaces and recordings match the standard ROS 2 tools.
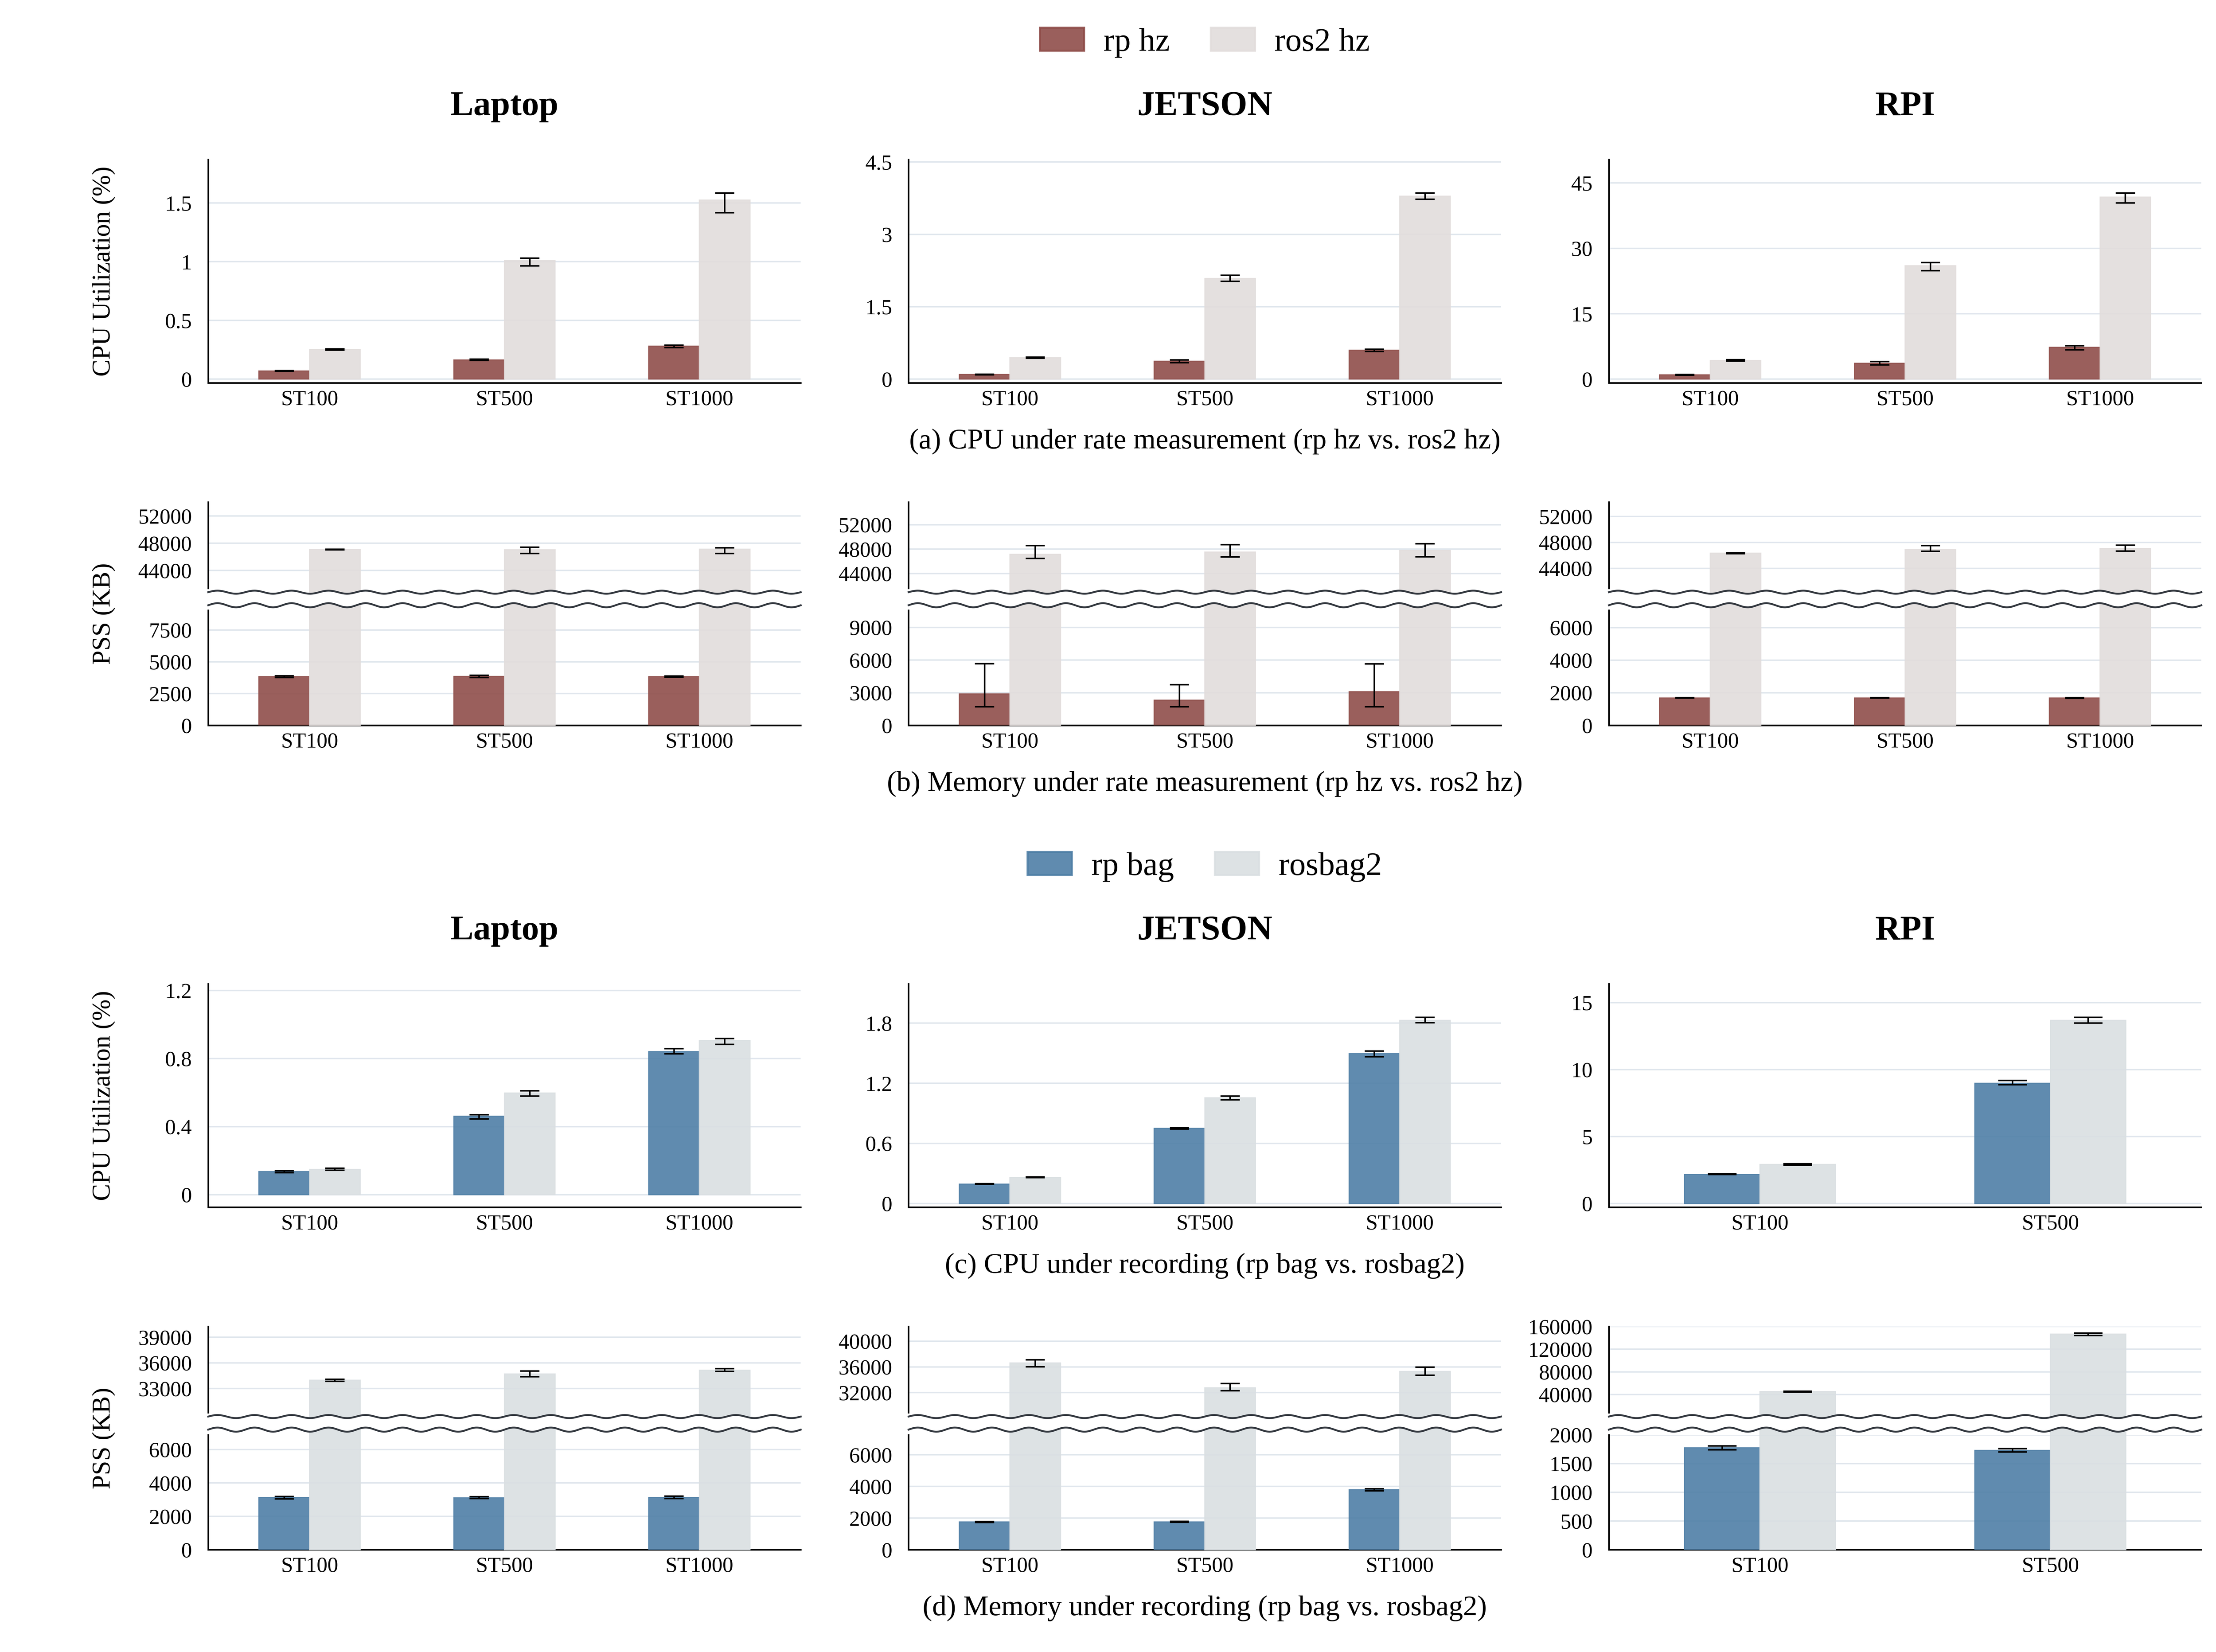
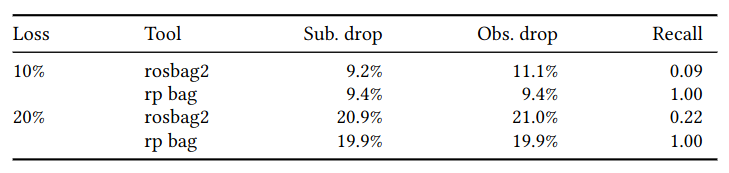
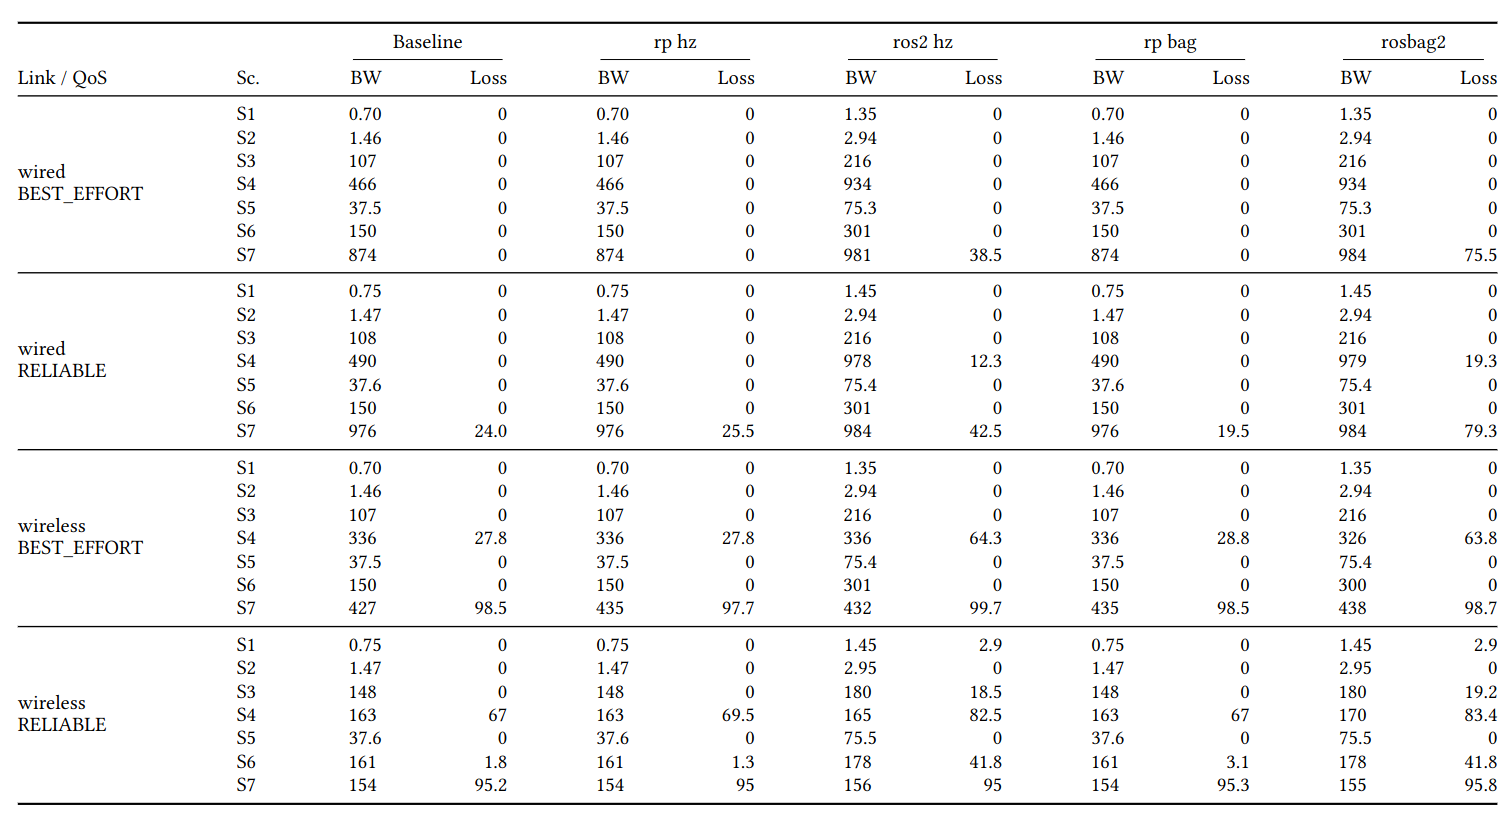
Across three hardware platforms (laptop, Jetson, and Raspberry Pi), two DDS implementations, and seven robot-operation workloads, ros2probe holds the discovery graph within 0.5% of an unobserved system, whereas domain-joining tools inflate discovery up to 2.6× and drop 38.5% of the subscriber's messages at saturation while ros2probe drops none. It reports loss with a recall of 1.0, cuts observer CPU and memory by up to 7× and 28×, and stays practical on the embedded robots where existing tools overload the system.
Four contributions
Non-intrusive Observation
Passive Observer architecture. No middleware participant at steady state. The monitoring tool does not become part of what it measures.
Adaptive Kernel-side Selectivity
Session-level topic interest compiles to a kernel filter. Fragment-aware fallback preserves correctness regardless of middleware configuration.
Discovery Race-free Selectivity
Data-centric, event-driven endpoint synchronisation: each discovery announcement immediately updates the kernel whitelist. Protocol ordering structurally prevents discovery-vs-data races.
Adaptive Visibility
SHM-only topics become visible on demand through a namespace-isolated DDS helper with SHM disabled.